4D-CT und Therapieplanung
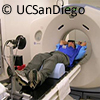 Die Physikgruppe in der Klinik für Strahlentherapie der Medizinischen Fakultät bietet verschiedene Themen für wissenschaftliche Team- und Individualprojekte sowie Bachelor- und Masterarbeiten an. Die Beschreibung der einzelnen Themen sind den unter “weitere Infos” stehenden Dokumenten zu entnehmen. Es handelt sich dabei vorrangig um das Testen einer 4D-CT Anlage, der Optimierung von Therapien sowie um die Erprobung von virtuellen Simulationen. Ein Anpassung der Themen an die entsprechenden Projektarten ist möglich.
Anforderungen
- Eigenständige Einarbeitung in neues Themengebiet
- u.U. Programmiererfahrung (C++ o.ä.)