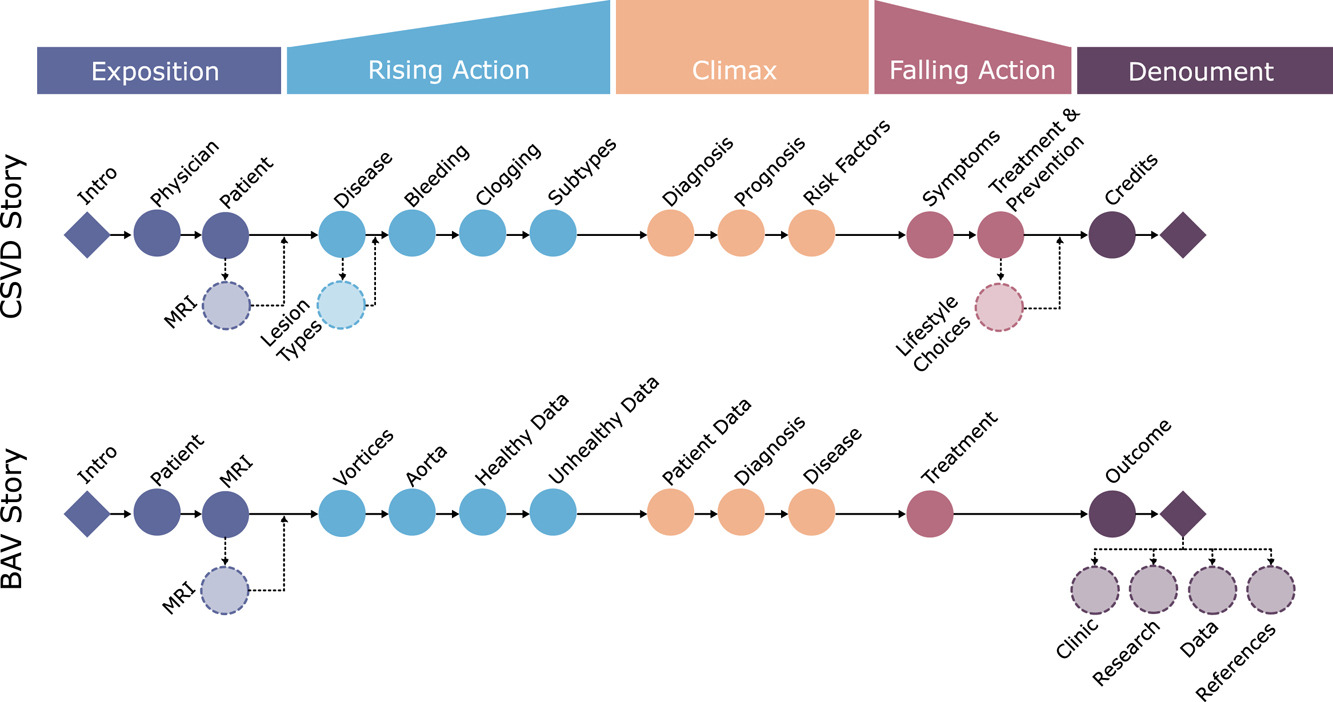
Disease Stories: Visual and Narrative Strategies for Scientific Disease Communication PhD Thesis
2025.
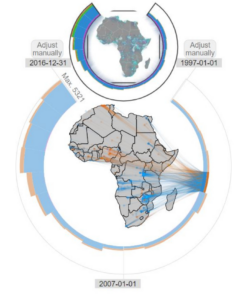
From Exploratory to Explanatory Interactive Visualization of Spatio-Temporal Conflict Data PhD Thesis
2024.
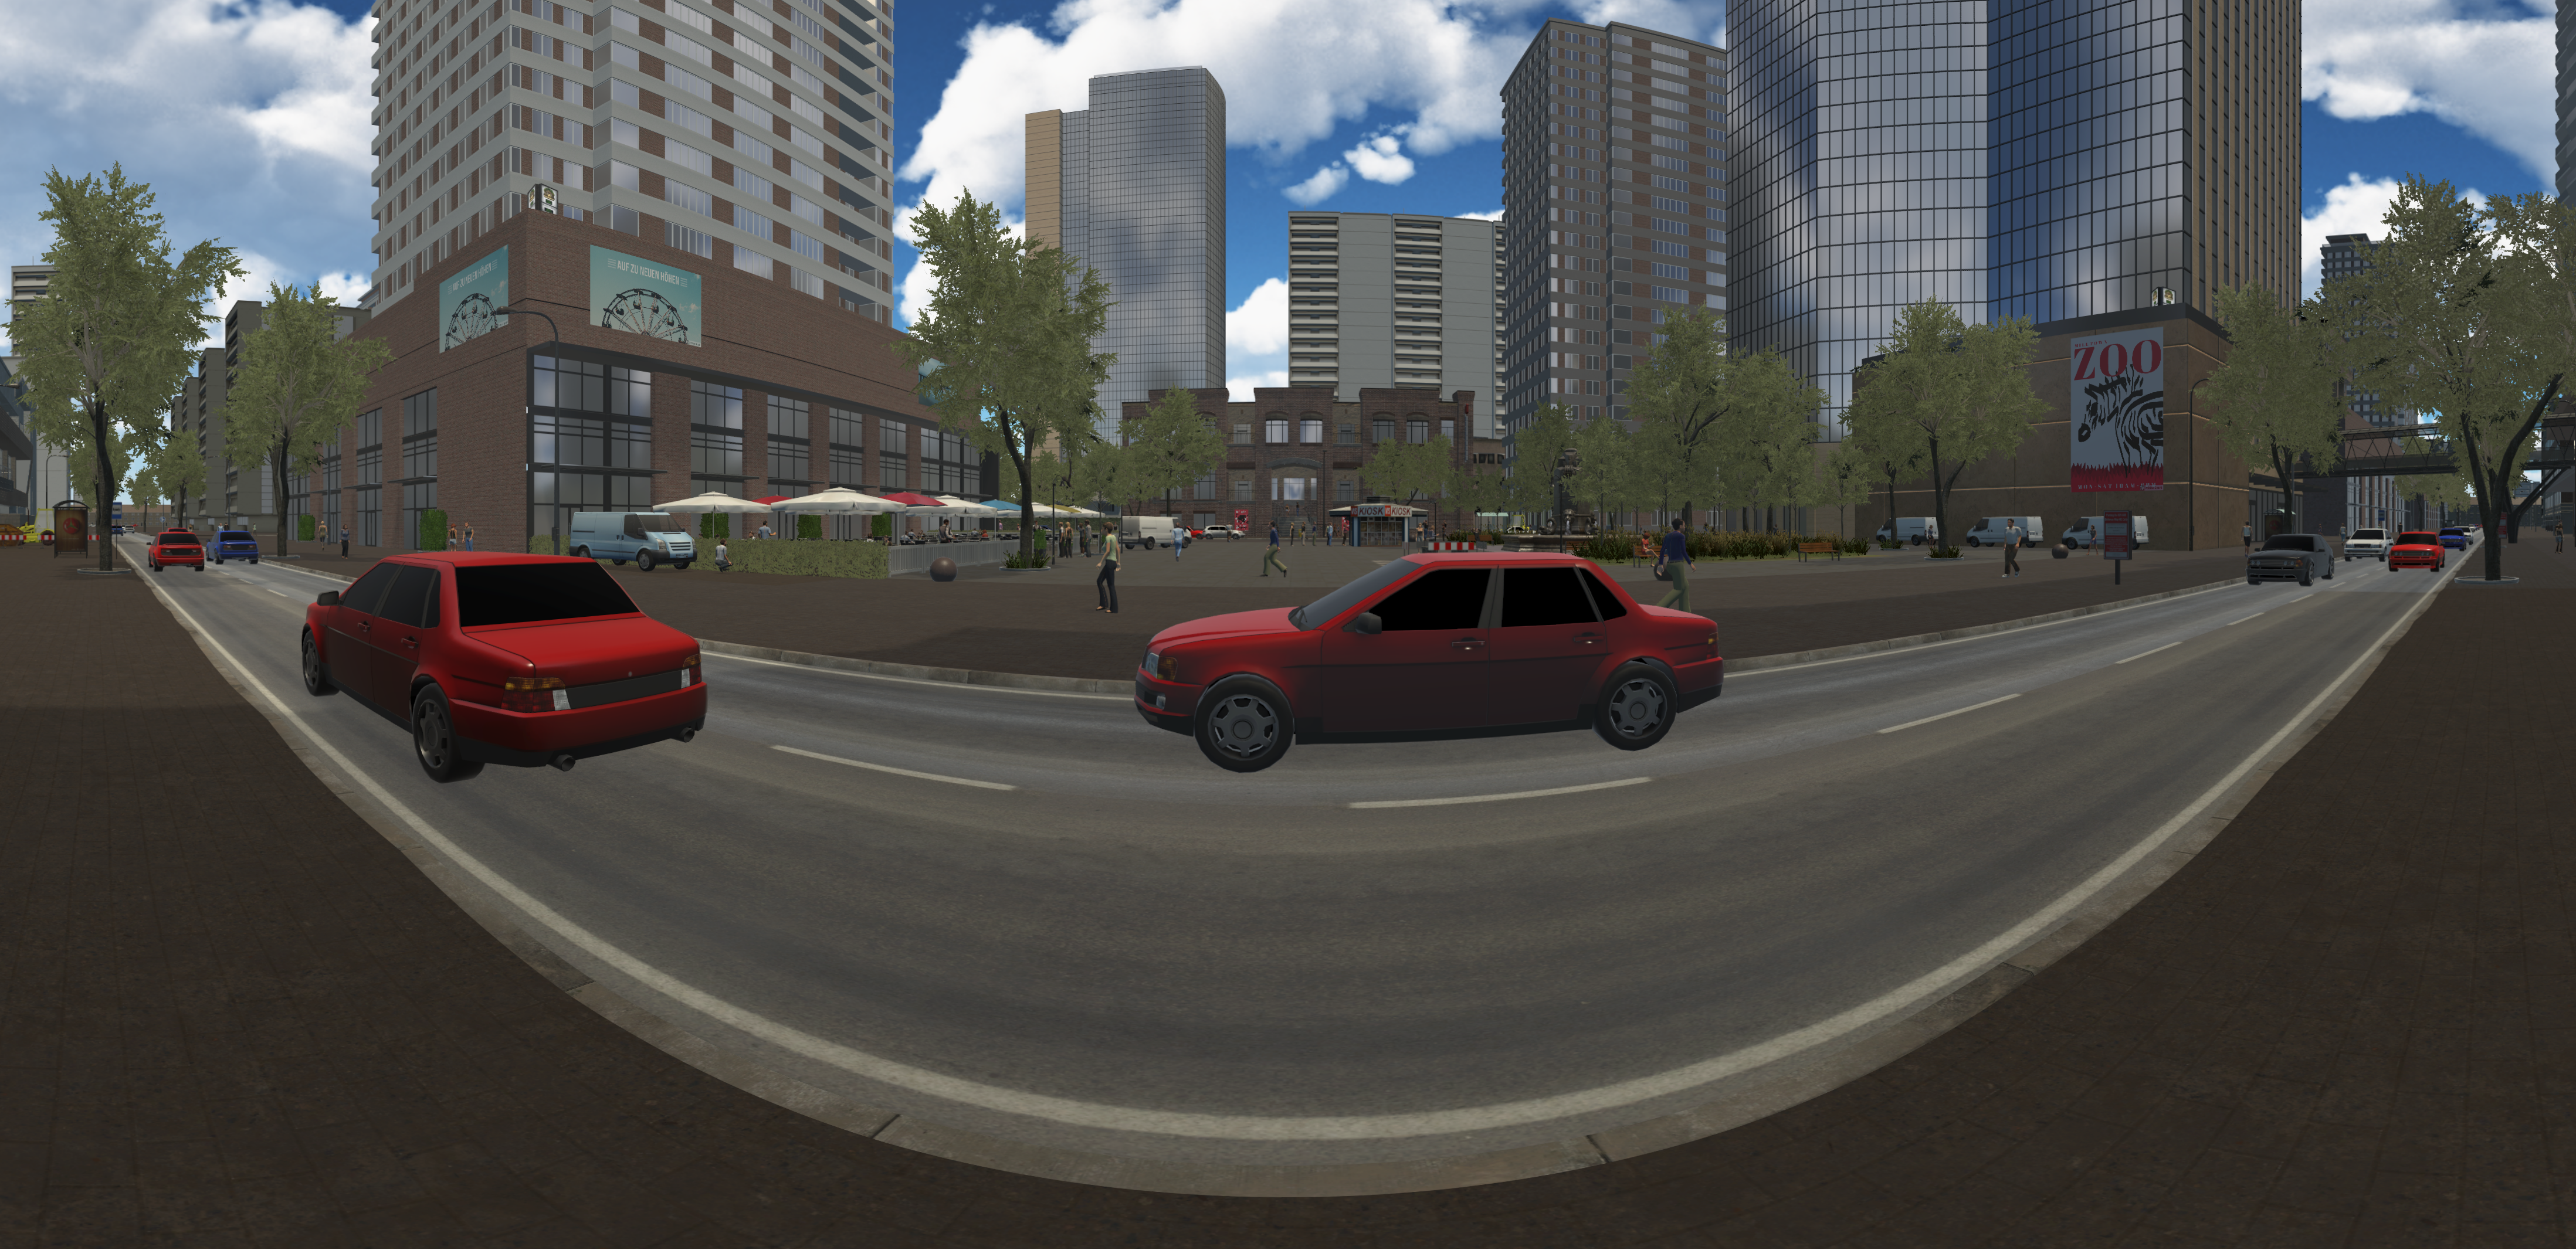
Applying Surgeon-centric Design to Advanced VR-based Medical Training PhD Thesis
Otto-von-Guericke University Magdeburg, 2024.
Virtual Reality for the Assessment of Unilateral Spatial Neglect and the Therapy of Acrophobia PhD Thesis
Otto-von-Guericke-Universität Magdeburg, 2022.
Visual Analytics of Epidemiological and Multi-Omics Data PhD Thesis
Otto-von-Guericke-Universität Magdeburg, 2021.
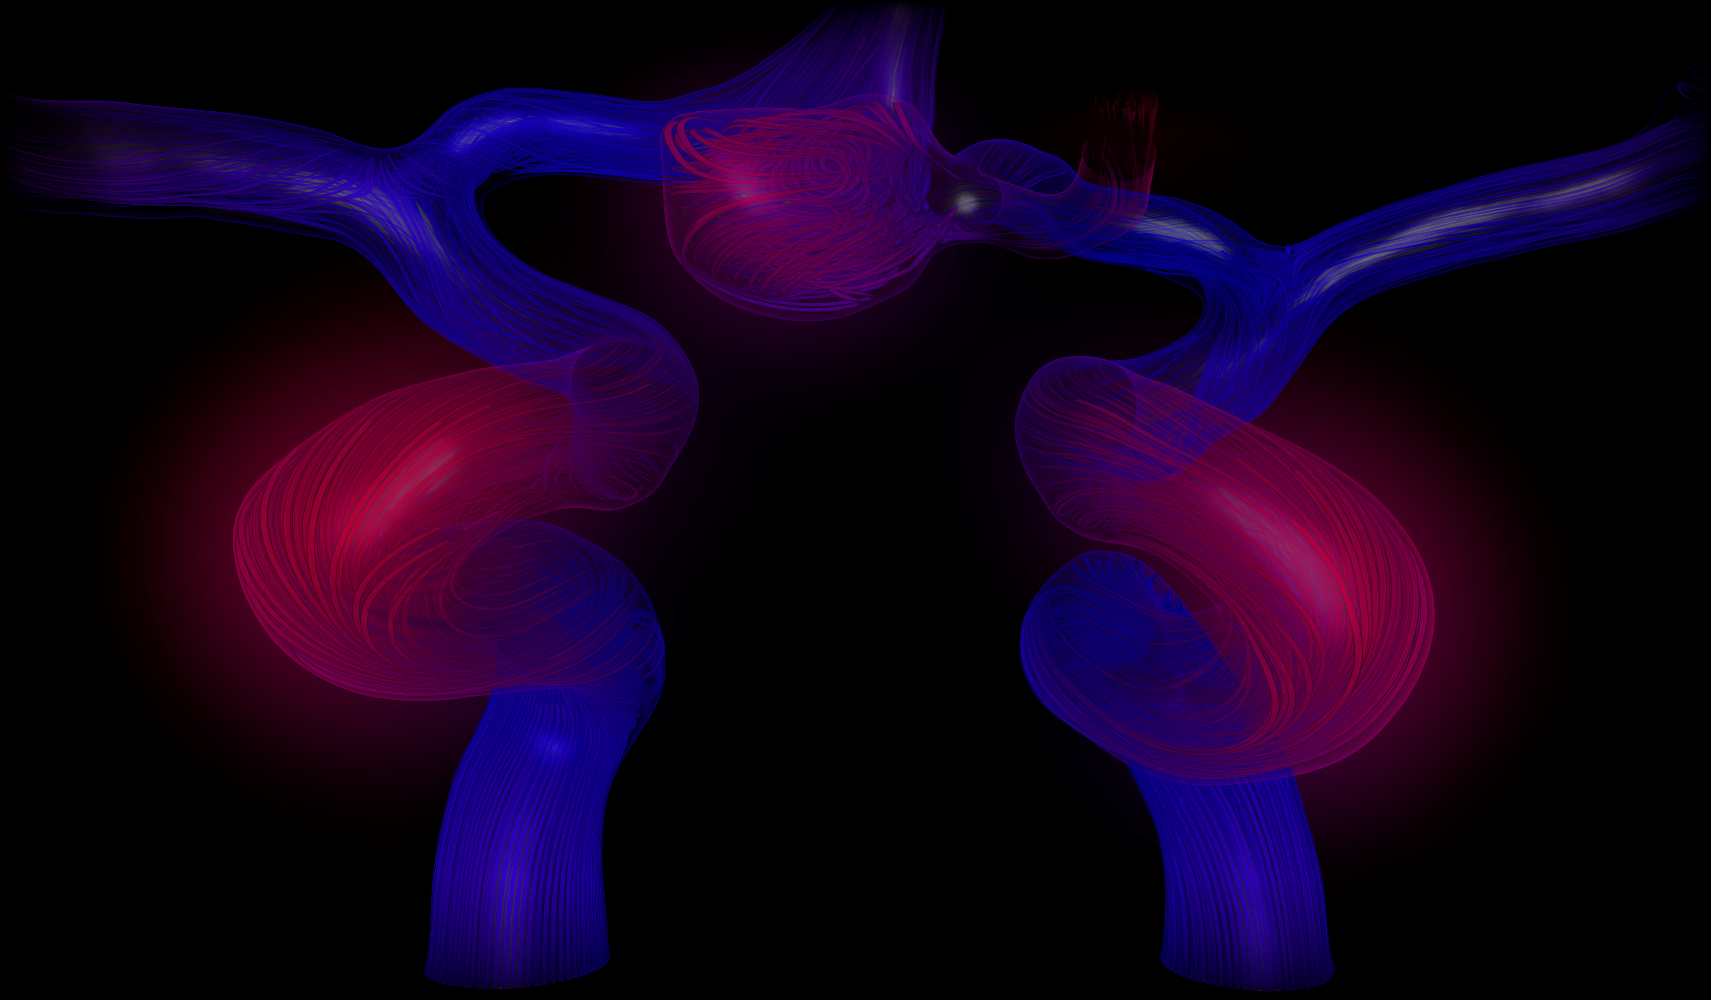
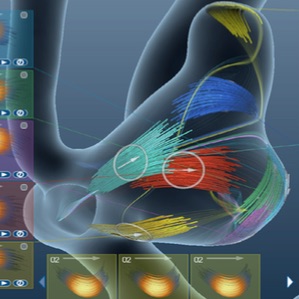
Visual Exploration and Comparison of Cardiac and Cerebral Blood Flow Data PhD Thesis
Otto-von-Guericke-Universität Magdeburg, 2020.
Maps, Risk, and Visualization-Supported Reports for Multimodal Medical Image Data PhD Thesis
Otto-von-Guericke University Magdeburg, 2020.
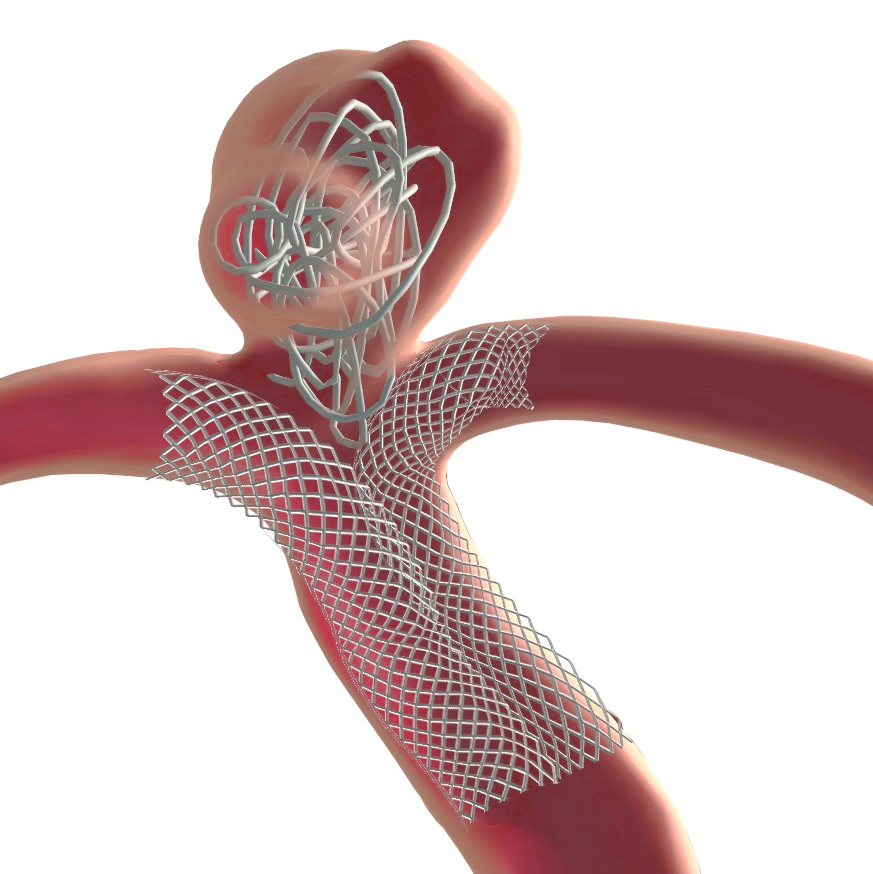
Visualization, Classification, and Interaction for Risk Analysis and Treatment Planning of Cerebral Aneurysms PhD Thesis
Otto-von-Guericke University Magdeburg, 2019.
3D User Interfaces for Interventional Support and Medical Education PhD Thesis
Otto-von-Guericke University Magdeburg, 2018.
Interactive Visual Analysis of Population Study Data PhD Thesis
Otto-von-Guericke University Magdeburg, 2016.

Guided qualitative and quantitative Analysis of cardiac 4D PC-MRI blood flow data PhD Thesis
Otto-von-Guericke University Magdeburg, 2016.
Vermessung von medizinischen Segementierungen für die chirurgische Interventionsplanung und Dokumentation PhD Thesis
Otto-von-Guericke University Magdeburg, 2016.
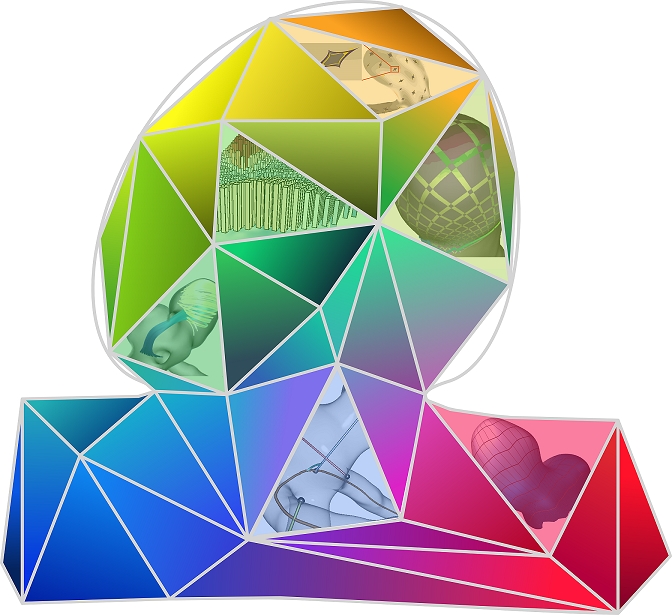
Perception Guided Evaluation of 3D Medical Visualizations PhD Thesis
Otto-von-Guericke University Magdeburg, 2015.
A Model-based Cortical Parcellation Scheme for High Resolution 7 Tesla MRI Data PhD Thesis
Otto-von-Guericke University Magdeburg, 2015.
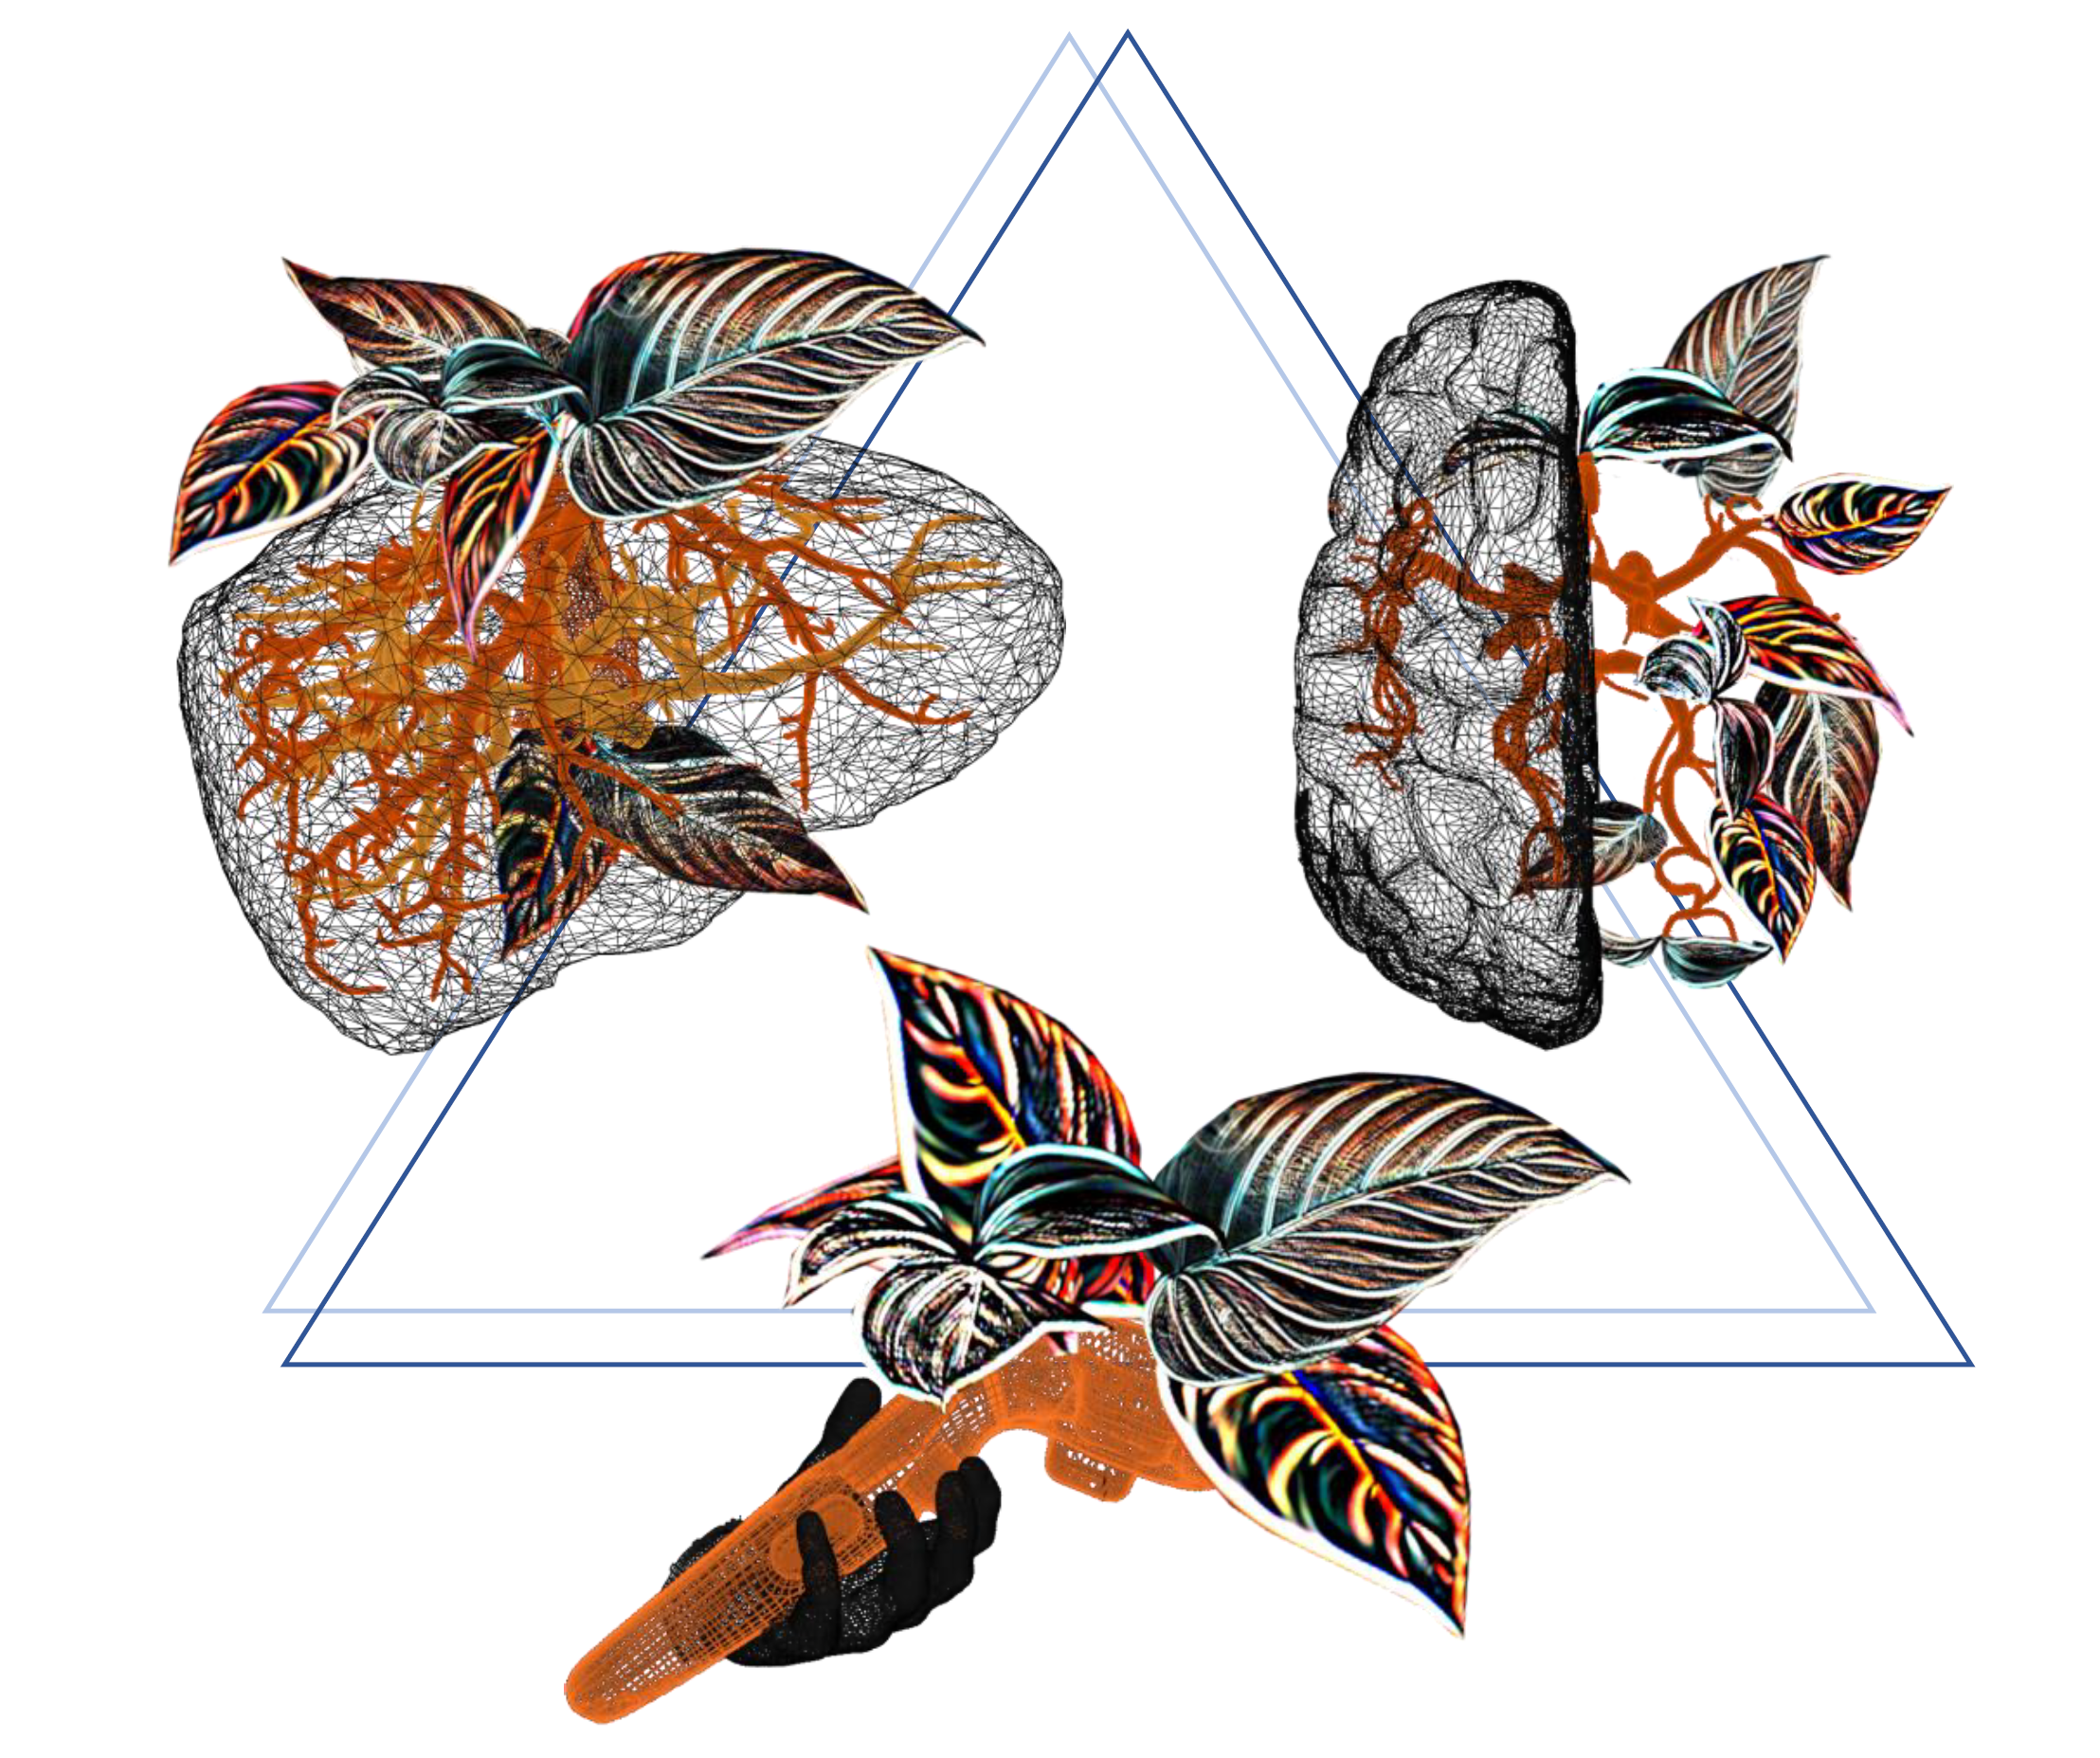
Interactive Visualization and Modification of Digitized Plant Biological Objects PhD Thesis
Otto-von-Guericke University Magdeburg, 2015.
Visual Exploration of Cardiovascular Hemodynamics PhD Thesis
Otto-von-Guericke University Magdeburg, 2014.
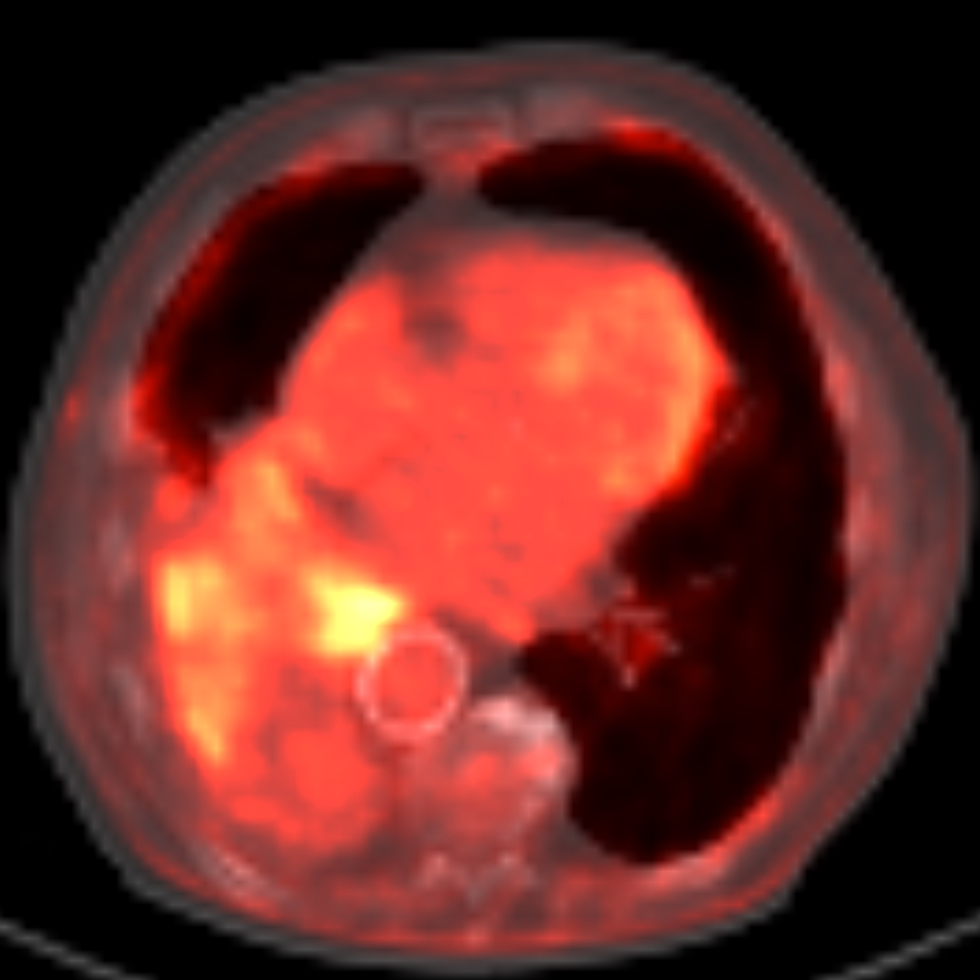
Visual Analysis, Clustering, and Classification of Contrast-Enhanced Tumor Perfusion MRI Data PhD Thesis
Otto-von-Guericke University Magdeburg, 2014.
Illustrative Visualization of Medical Data Sets PhD Thesis
Otto-von-Guericke University Magdeburg, 2014.
Context-Aware 3D Model Generation for Biomedical Applications PhD Thesis
Otto-von-Guericke University Magdeburg, 2014.
Computergestützte Exploration von Blutfluss in zerebralen Aneurysmen - geometrische Verarbeitung und interaktive Visualisierung PhD Thesis
Otto-von-Guericke University Magdeburg, 2014.
Entwicklung von Verfahren zur interaktiven Stimulation minimal-invasiver Operationsmethoden PhD Thesis
Otto-von-Guericke University Magdeburg, 2014.
Konzeption, Entwicklung und Evaluierung chirurgischer Trainingssysteme PhD Thesis
Otto-von-Guericke University Magdeburg, 2011.
GPU-based Medical Image Segmentation and Registration PhD Thesis
Otto-von-Guericke University Magdeburg, 2010.
Animationen und Explorationstechniken zur Unterstützung der chirurgischen Operationsplanung PhD Thesis
Otto-von-Guericke University Magdeburg, 2010.
Visual Exploration and Analysis of Perfusion Data PhD Thesis
Otto-von-Guericke University Magdeburg, 2010.
Illustrative Visualisierungstechniken zur Unterstützung der präoperativen Planung von chirurgischen Eingriffen PhD Thesis
Otto-von-Guericke University Magdeburg, 2009.
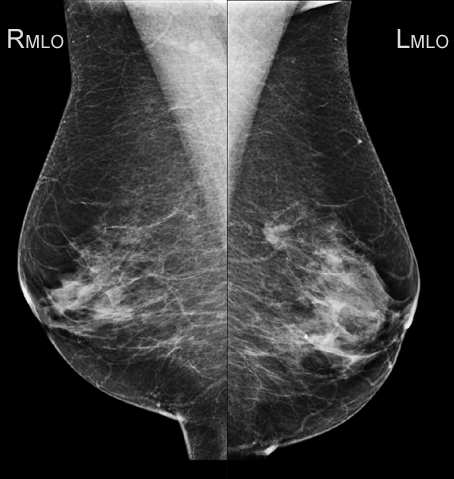
Bestimmung der Kontrastempfindlichkeit im Mammogramm und ihre Bedeutung für die bildbasierte Befundung PhD Thesis
Otto-von-Guericke University Magdeburg, 2009.
Interaktive und dynamische Visualisierung für die chirurgische Ausbildung und Interventionsplanung PhD Thesis
Otto-von-Guericke University Magdeburg, 2008.
Model-based Analysis and Evaluation of Point Sets from Optical 3D-Laser-Scanners PhD Thesis
Otto-von-Guericke University Magdeburg, 2007.