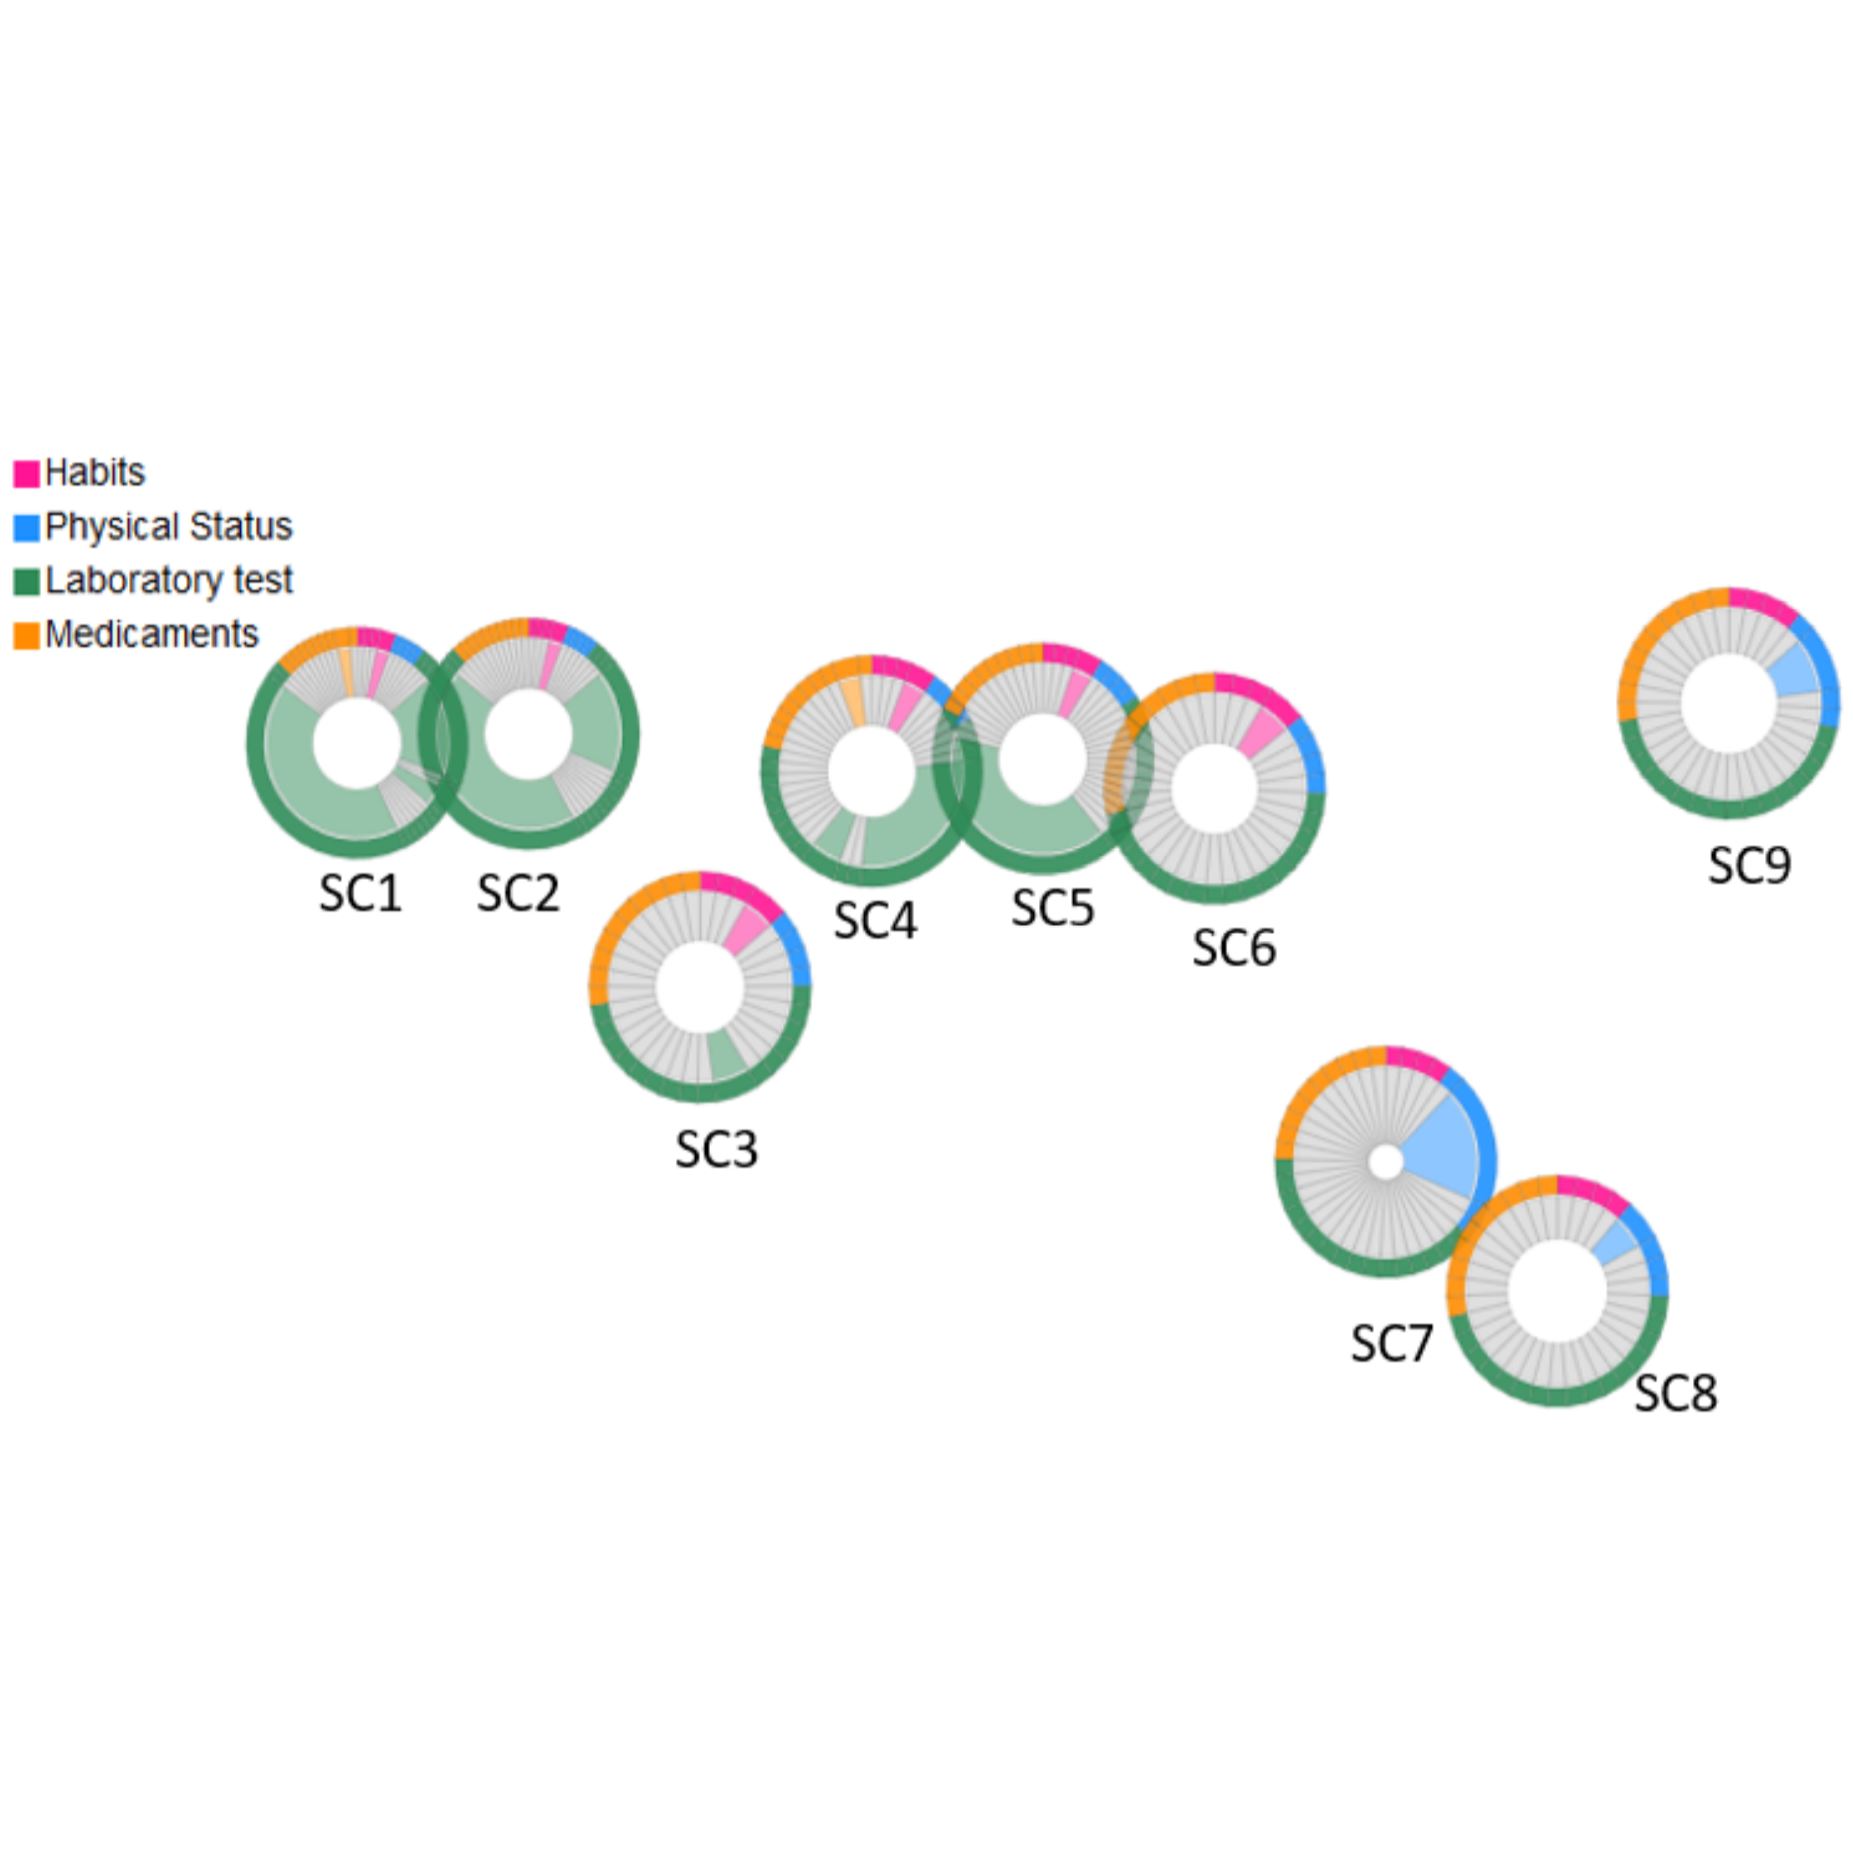
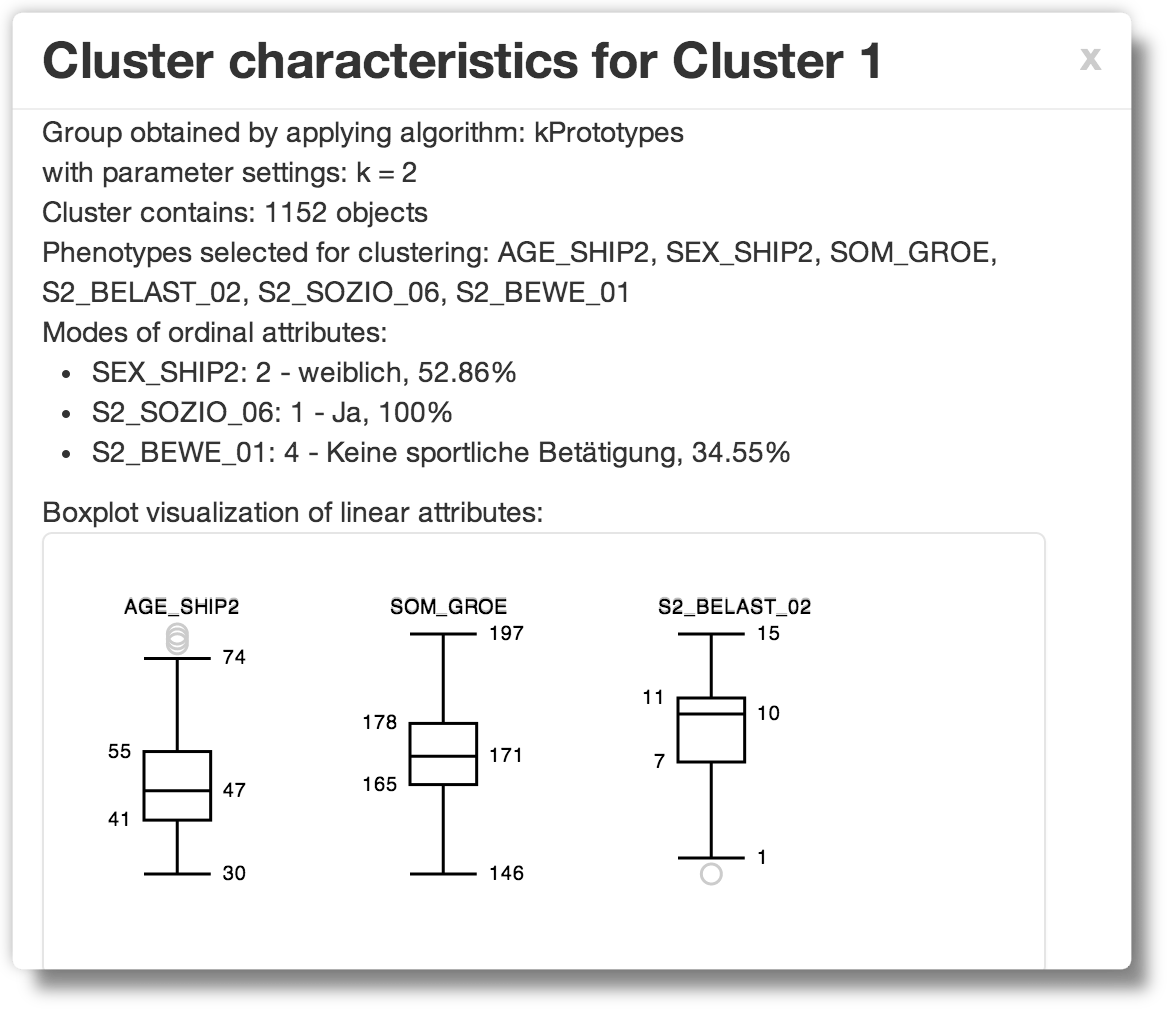
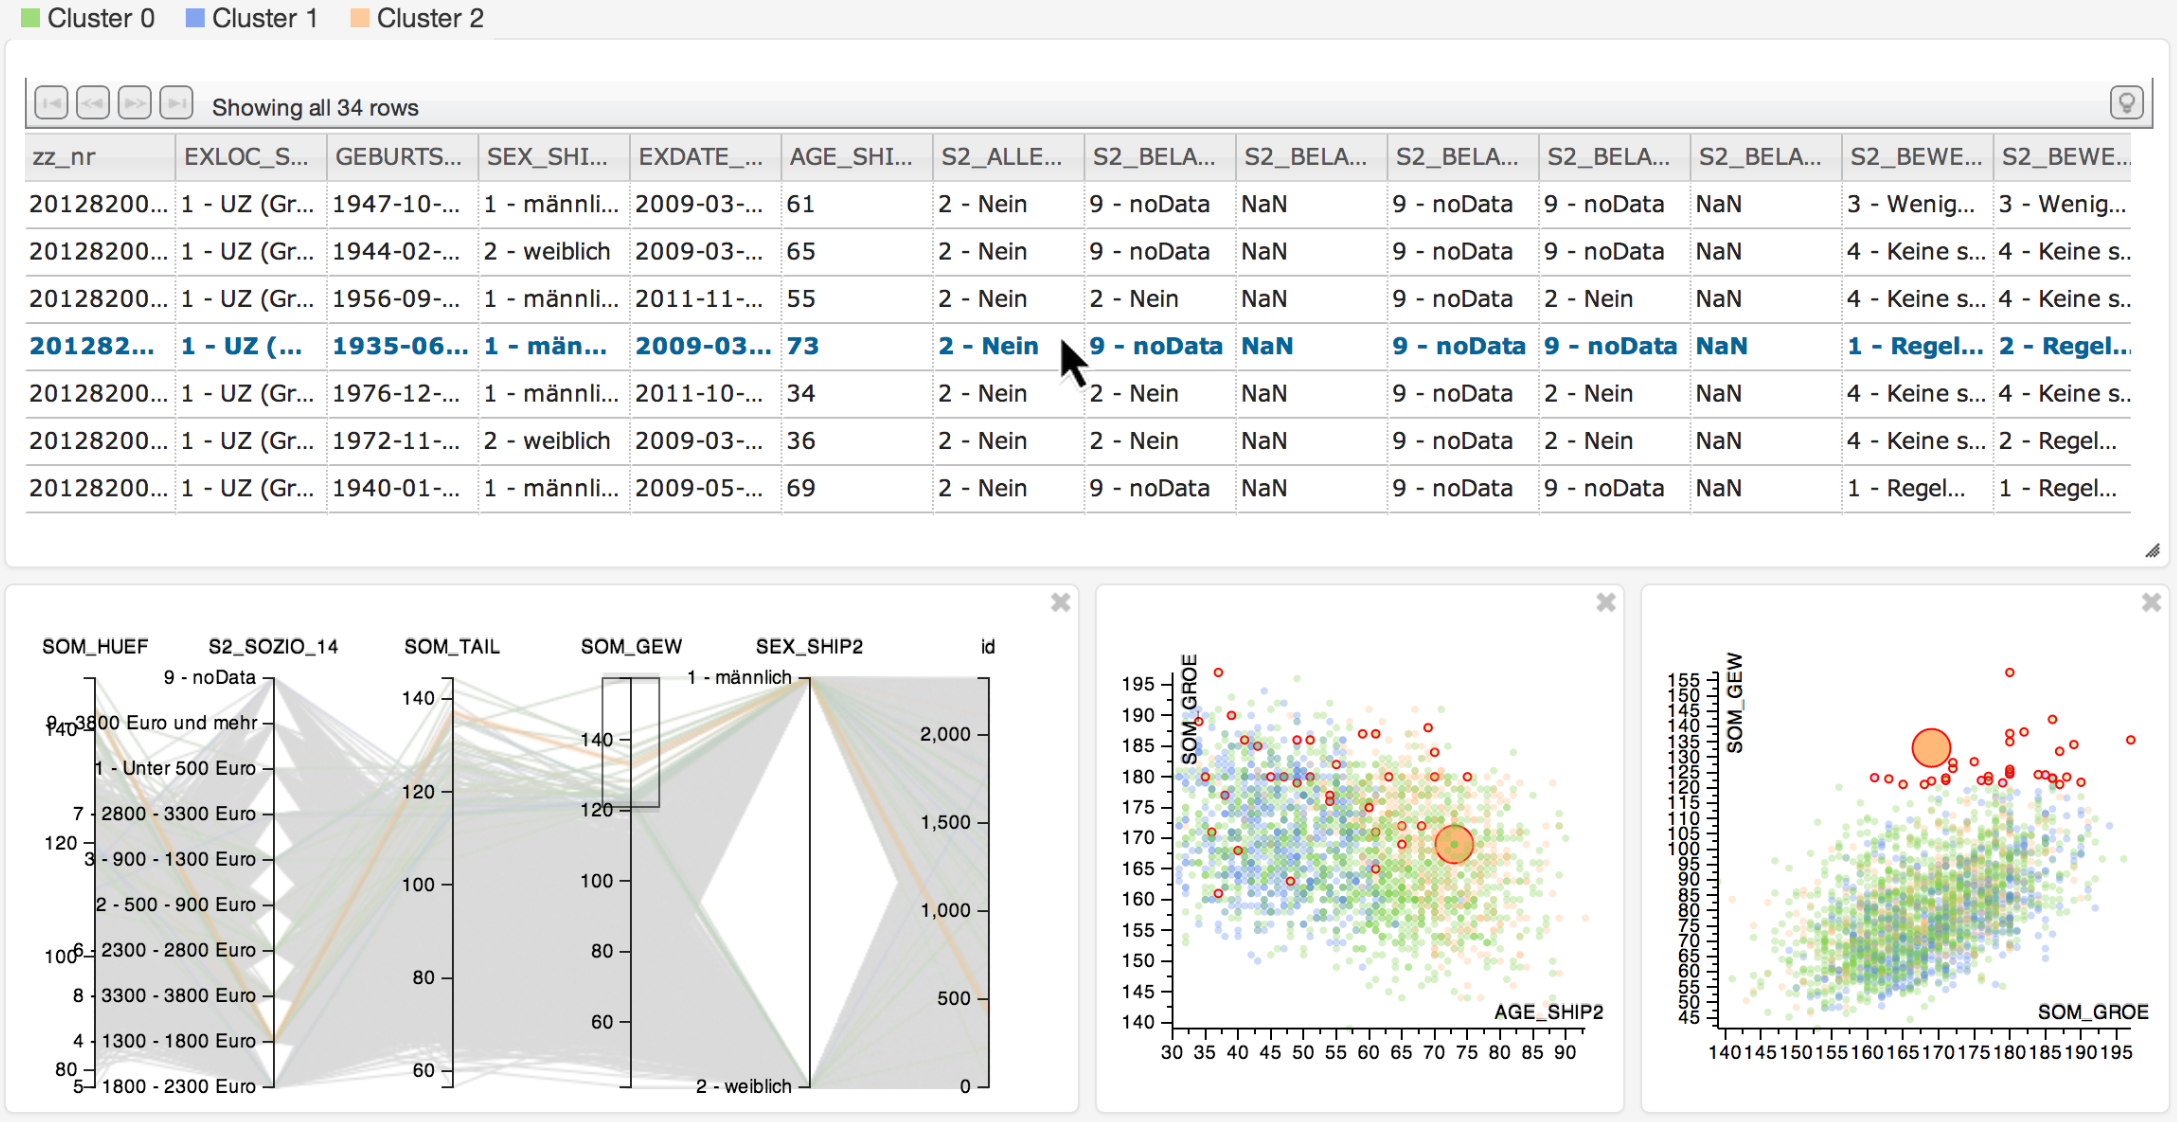
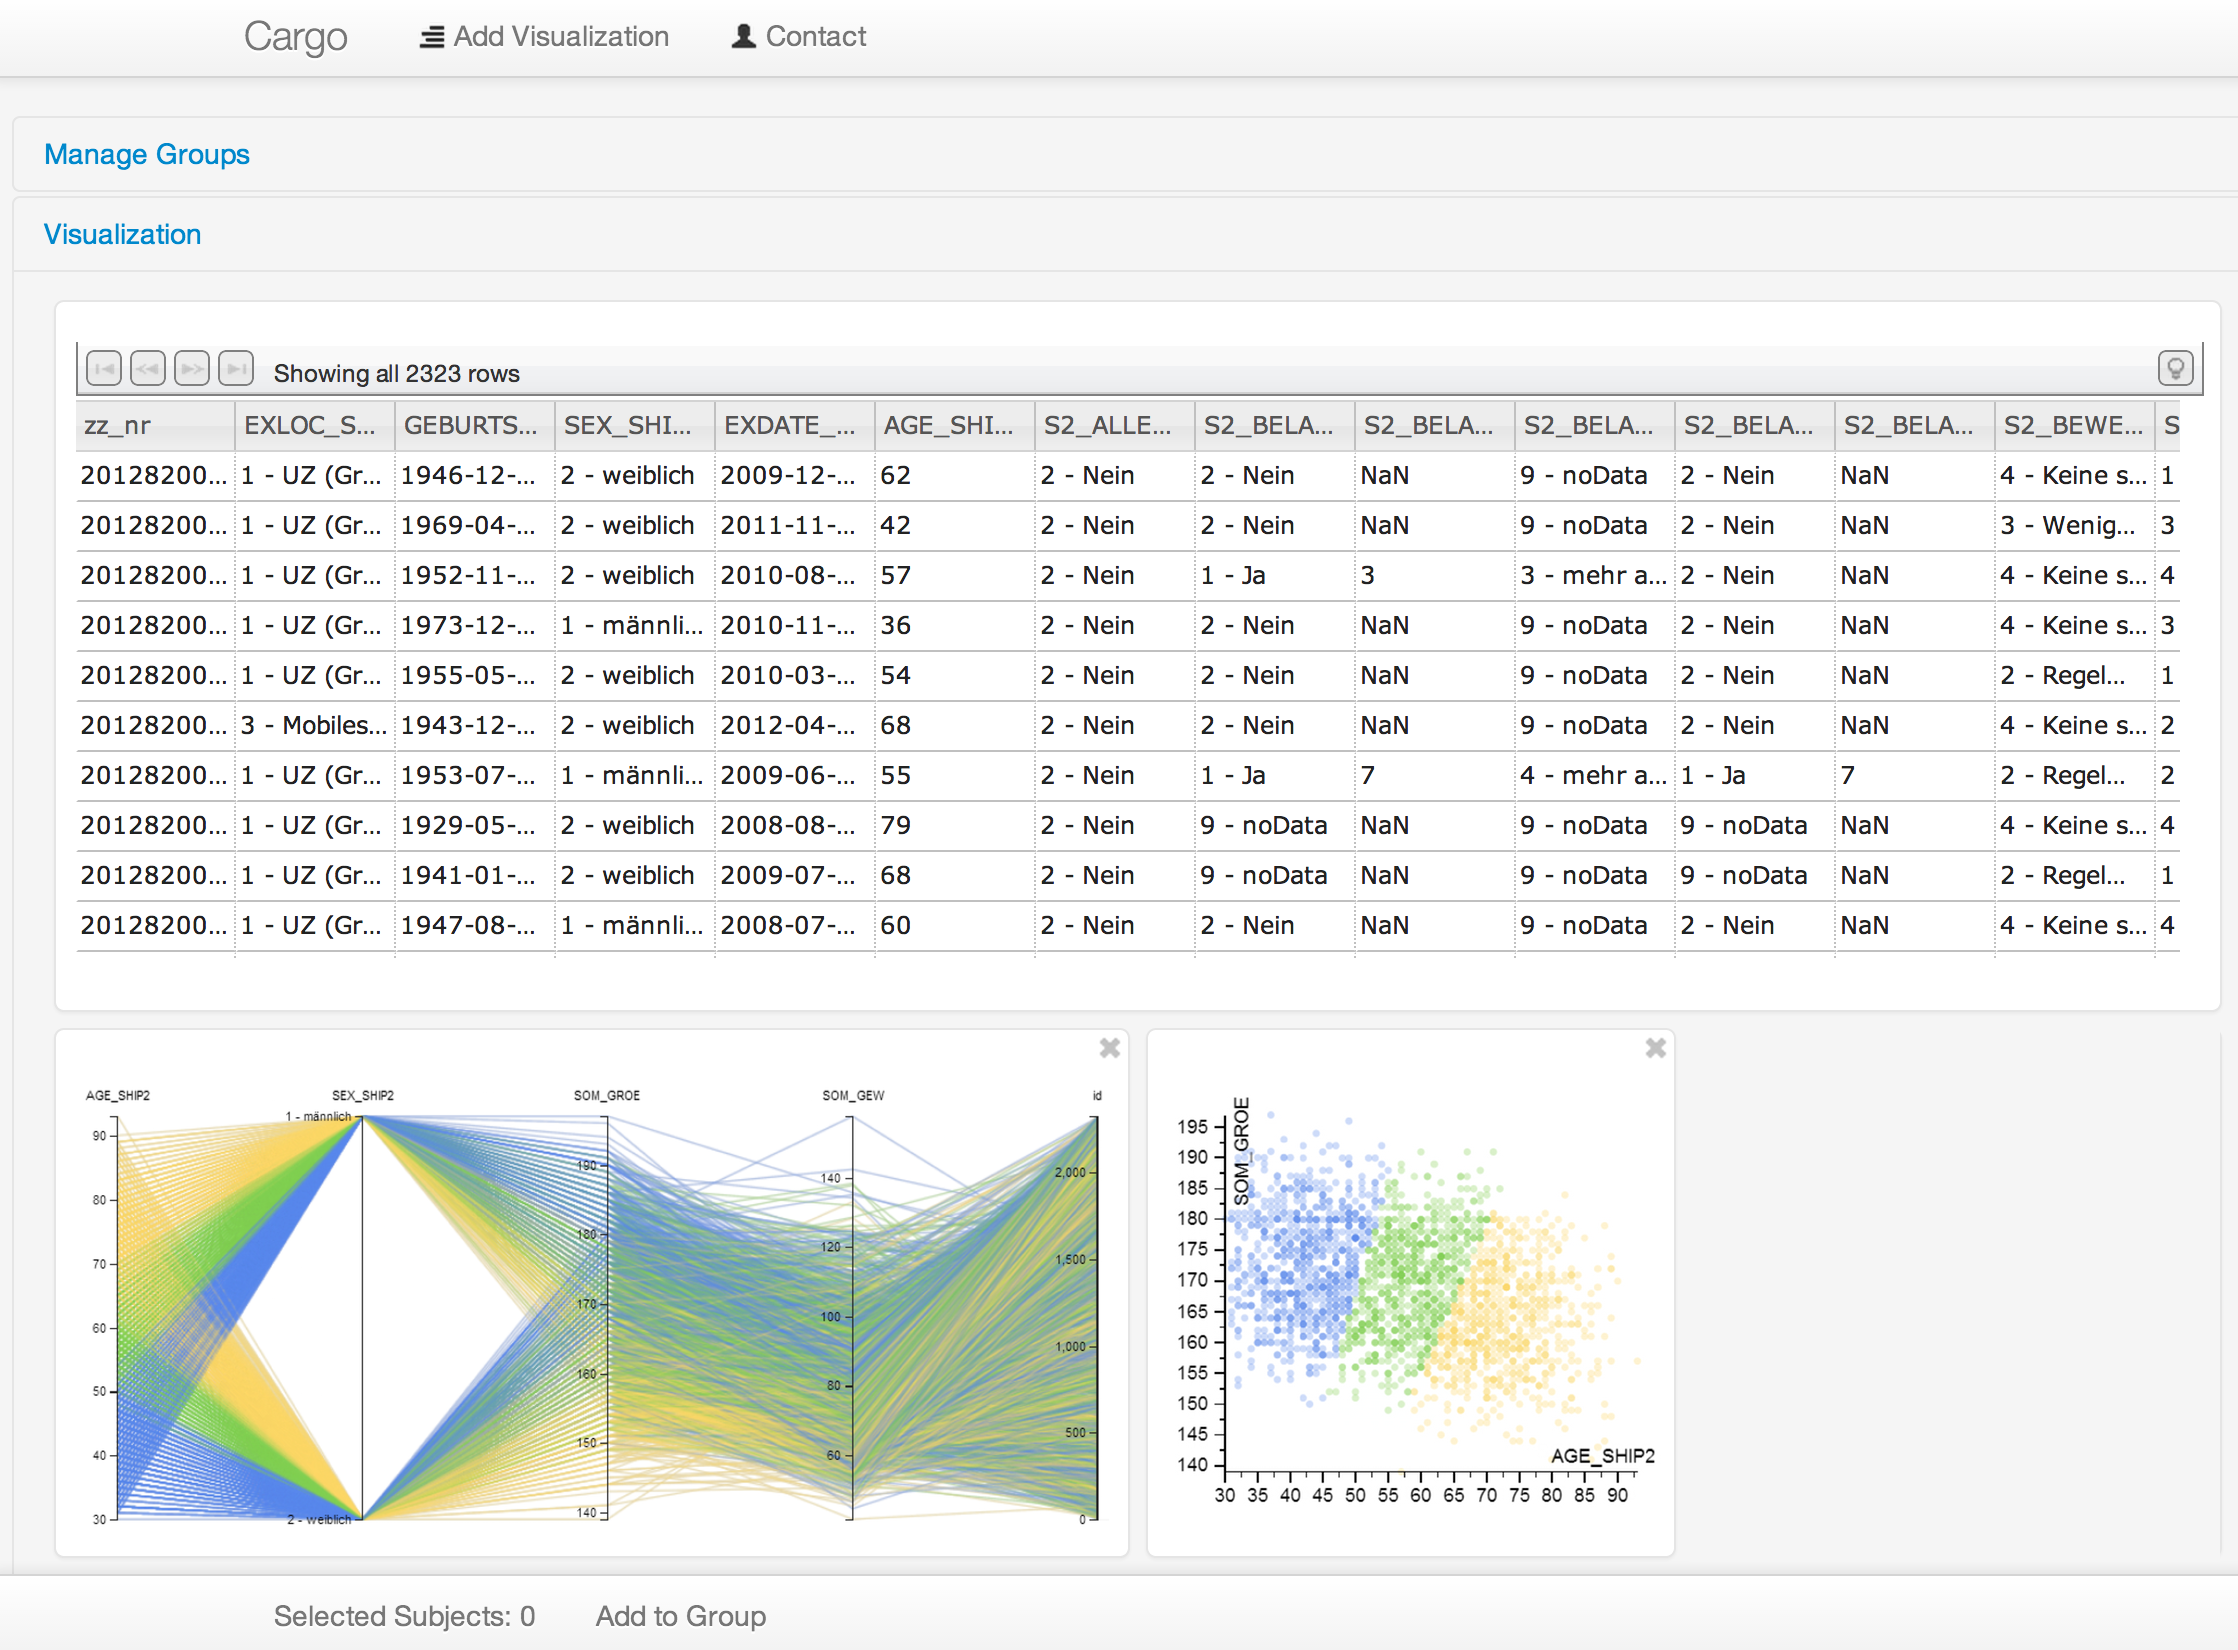
The essence of epidemiology is the analysis of relations between causes and consequences on the health of the people. What combination of influences leads to an increased risk of getting a particular disease? In order to be able to analyze these complex associations, it requires extensive data basis in the form of populations studies as the “Study of Health in Pomerania” (SHIP), which iterativly gathers data for a large group of subjects (a cohort). To grasp the complex connections of this data, tools and visualizations are needed which go beyond the traditional statistical approaches used by epidemiologists. Techniques which connect the various socio-demographic and medical parameters in an interactive framework are needed to amplify the hypothesis-driven analysis of the complex data sets.
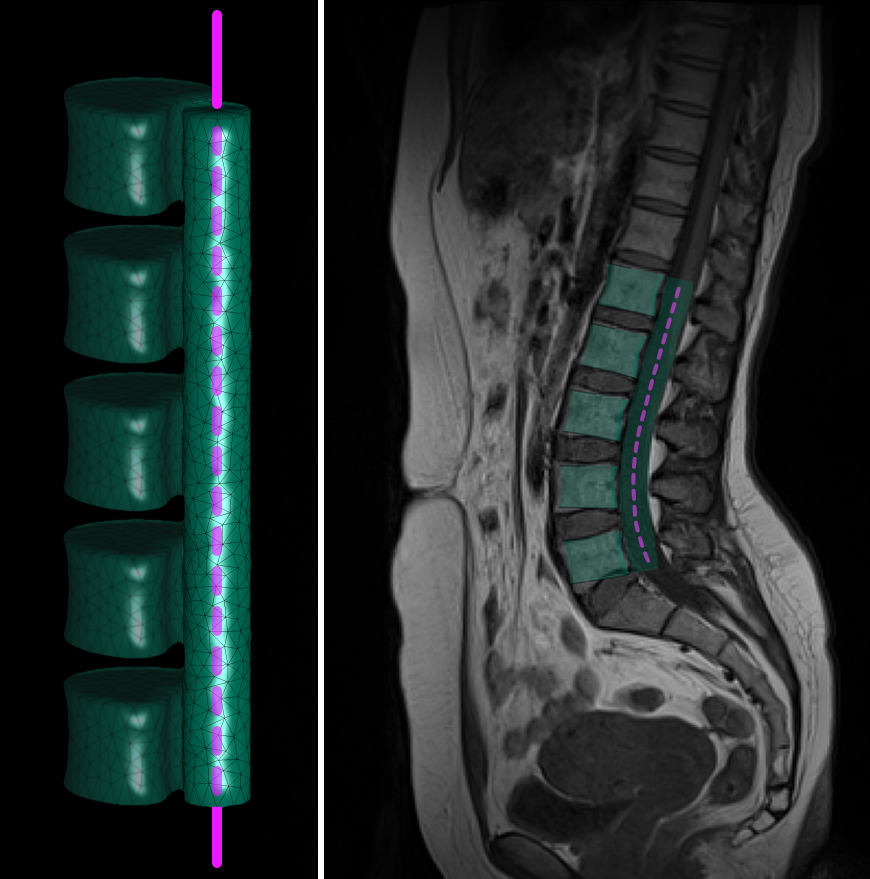
Medical image processing and visualization gaining in importance in epidemiology, since full body MRI scans are part of the data acquisition of large studies such as the SHIP. In addition to the detection of pathologies, the epidemiologists interested in offering new statistical indicators, such as the extent of a given structure or distances between different tissue types.
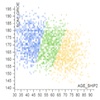
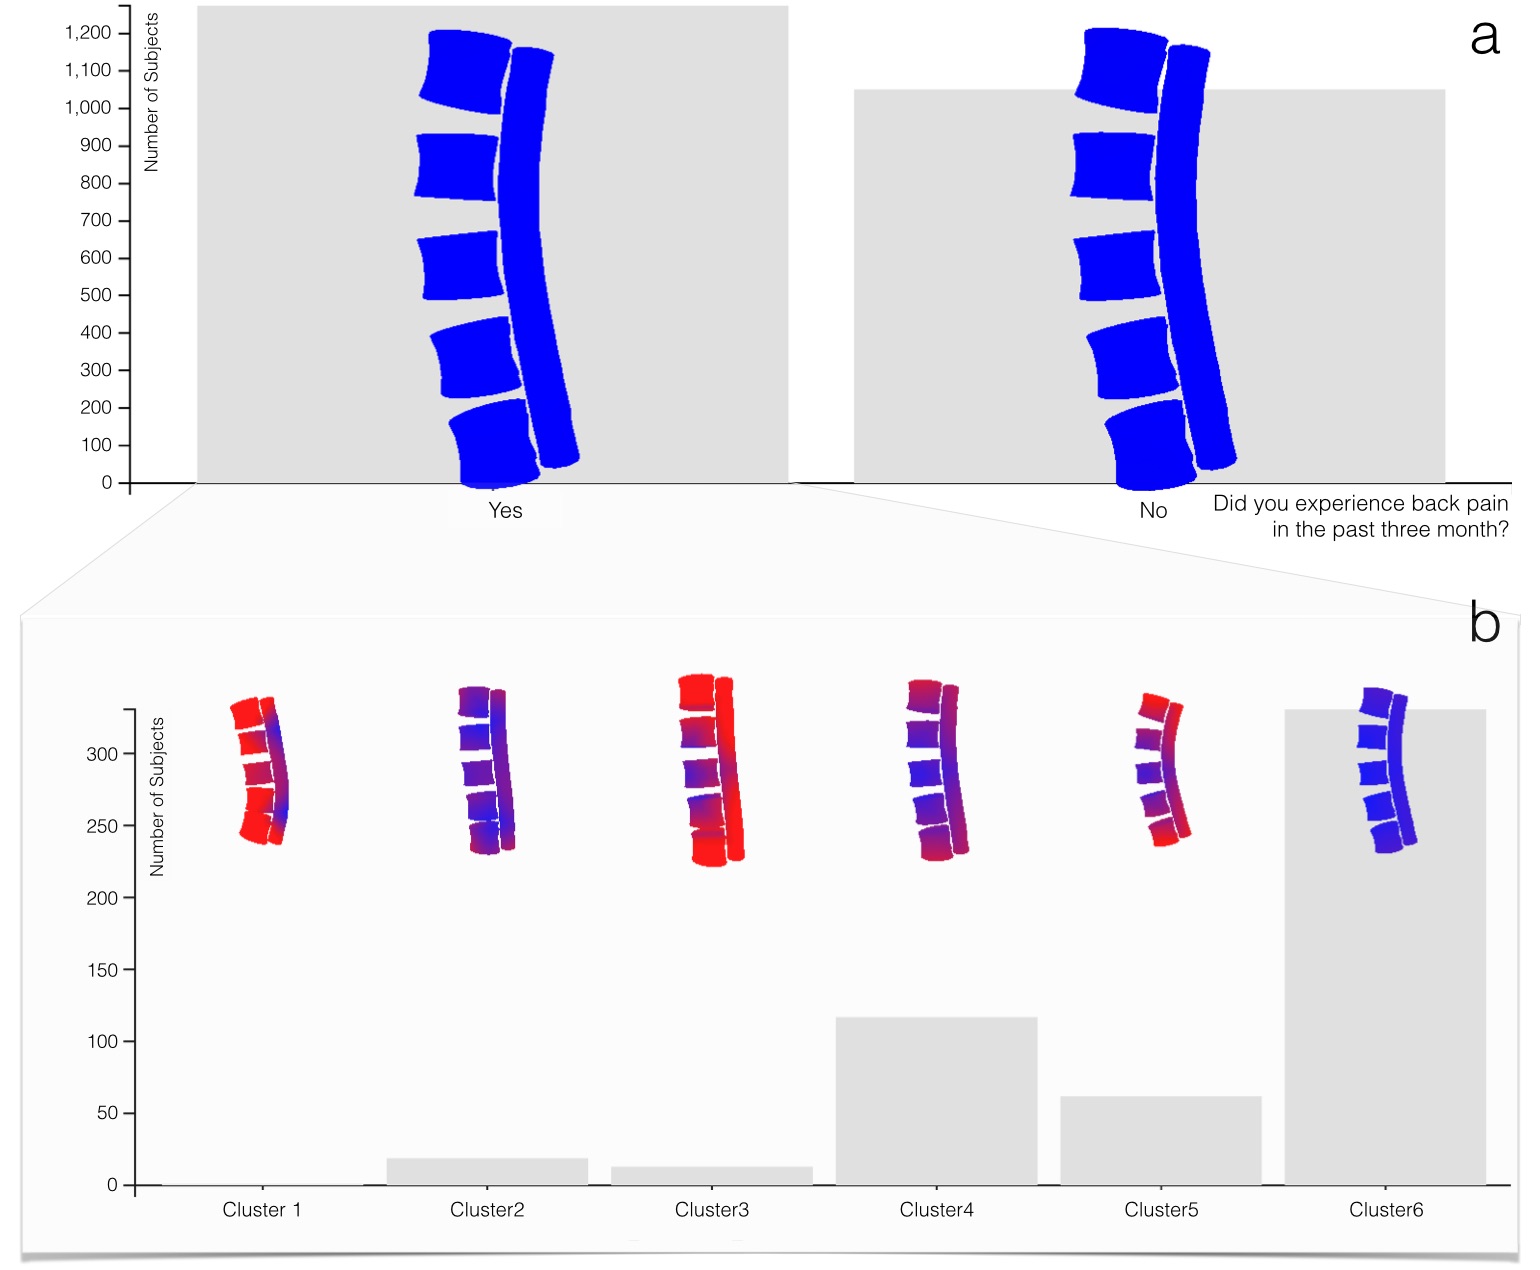
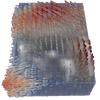
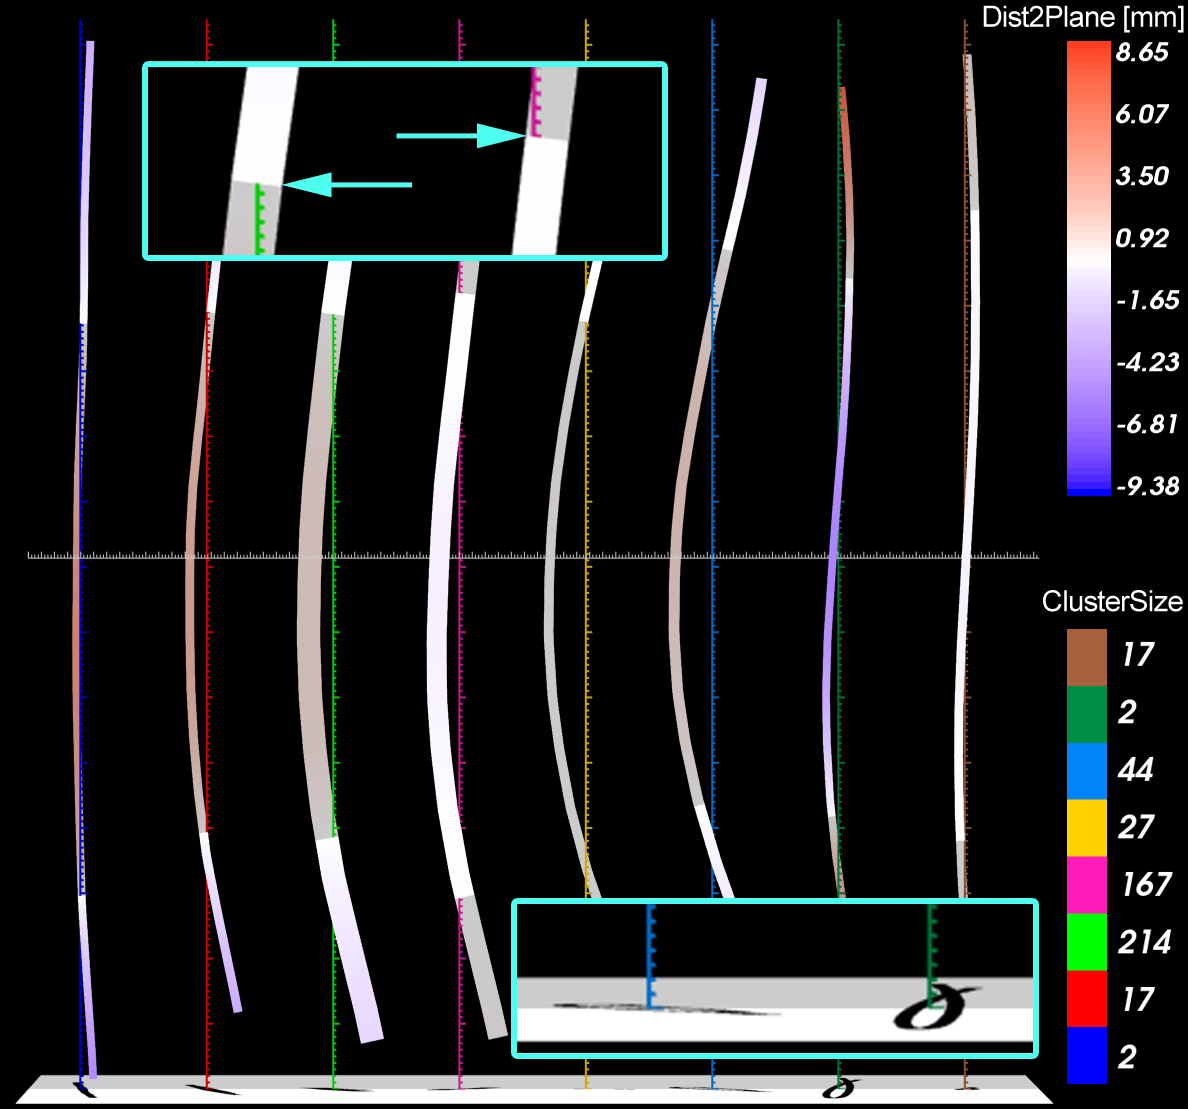
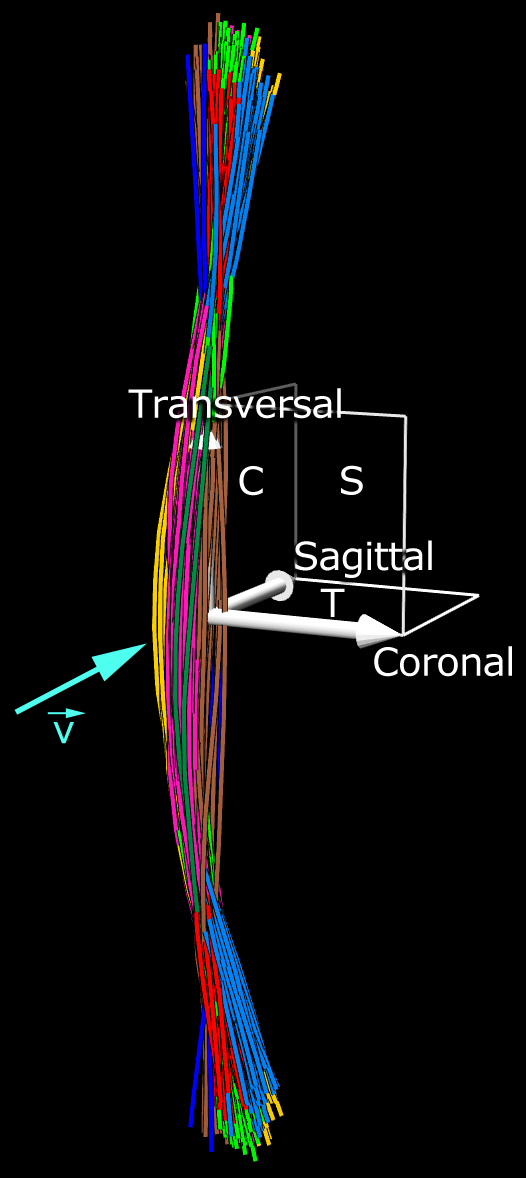
We focussed initially on the shape variation analysis of the spine. In practical terms, to distinguish pathological shape variance of age-related phenomena. To allow fot that, the medical data sets had to be processed in a way that allows comparisons between different subjects. We want to extend this approach in the next step of the entire lumbar spine.
As long-term goal we strive for a system that uses techniques of information visualization on socio-demographic and medical parameters and connects them with shape variance visualization of relevant structures. Such a system season would not be an impor-tant tool for epidemiologists who have statistical analysis and image-based to a large extent separate from each other methodically.
In addition to the goals specified in the project proposal, we are also interested in a in-depth understanding of epidemiological workflows and reasoning and coupling information visualizations with statistical tools. We focus on spine-related diseases and an understanding of socio-demographic variables and results from image processing (spine centerline, shapes of individual vertebrae) on and potential correlations to the disease status.
Publications
2019
Bernhard Preim, Shiva Alemzadeh, Till Ittermann, Paul Klemm, Uli Niemann, Myra Spiliopoulou
Visual Analytics for Epidemiological Cohort Studies Proceedings Article
In: Proc. of Eurographics Medical Price, 2019.
@inproceedings{Preim_2019_MedP,

title = {Visual Analytics for Epidemiological Cohort Studies},

author = {Bernhard Preim and Shiva Alemzadeh and Till Ittermann and Paul Klemm and Uli Niemann and Myra Spiliopoulou},

url = {https://www.vismd.de/wp-content/uploads/legacy/preim_2019_medp.pdf, PDF Download},

year  = {2019},

date = {2019-01-01},

booktitle = {Proc. of Eurographics Medical Price},

keywords = {},

pubstate = {published},

tppubtype = {inproceedings}

}
2015
Paul Klemm, Kai Lawonn, Sylvia Glaßer, Uli Niemann, Katrin Hegenscheid, Henry Völzke, Bernhard Preim
3D Regression Heat Map Analysis of Population Study Data Journal Article
In: IEEE Transactions on Visualization and Computer Graphics (TVCG), vol. 22 (1), no. 1, pp. 81–90, 2015.
@article{Klemm_2015_TVCG,

title = {3D Regression Heat Map Analysis of Population Study Data},

author = {Paul Klemm and Kai Lawonn and Sylvia Glaßer and Uli Niemann and Katrin Hegenscheid and Henry Völzke and Bernhard Preim},

url = {https://www.vismd.de/wp-content/uploads/legacy/klemm_2015_tvcg.pdf, PDF Download

https://www.youtube.com/watch?v=diSOEGnZJLM, YouTube},

year  = {2015},

date = {2015-01-01},

journal = {IEEE Transactions on Visualization and Computer Graphics (TVCG)},

volume = {22 (1)},

number = {1},

pages = {81--90},

keywords = {},

pubstate = {published},

tppubtype = {article}

}
Klaus-Dietz Tönnies, Oliver Gloger, Marko Rak, Charlotte Winkler, Paul Klemm, Bernhard Preim, Henry Völzke
Image analysis in epidemiological applications Journal Article
In: it - Information Technology, vol. 57, no. 1, pp. 22–29, 2015.
@article{toennies_2015_it,

title = {Image analysis in epidemiological applications},

author = {Klaus-Dietz Tönnies and Oliver Gloger and Marko Rak and Charlotte Winkler and Paul Klemm and Bernhard Preim and Henry Völzke},

url = {https://www.vismd.de/wp-content/uploads/legacy/toennies_2015_it.pdf, PDF Download},

doi = {10.1515/itit-2014-1071},

year  = {2015},

date = {2015-01-01},

journal = {it - Information Technology},

volume = {57},

number = {1},

pages = {22--29},

keywords = {},

pubstate = {published},

tppubtype = {article}

}
Paul Klemm, Sylvia Glaßer, Kai Lawonn, Marko Rak, Henry Völzke, Katrin Hegenscheid, Bernhard Preim
Interactive Visual Analysis of Lumbar Back Pain Proceedings Article
In: Proc. of the 6th International Conference on Information Visualization Theory and Applications (IVAPP), pp. 85–92, Berlin, 2015.
@inproceedings{klemm_2015_ivapp,

title = {Interactive Visual Analysis of Lumbar Back Pain},

author = {Paul Klemm and Sylvia Glaßer and Kai Lawonn and Marko Rak and Henry Völzke and Katrin Hegenscheid and Bernhard Preim},

url = {https://www.vismd.de/wp-content/uploads/legacy/klemm_2015_ivapp.pdf, PDF Download},

year  = {2015},

date = {2015-00-01},

booktitle = {Proc. of the 6th International Conference on Information Visualization Theory and Applications (IVAPP)},

pages = {85--92},

address = {Berlin},

keywords = {},

pubstate = {published},

tppubtype = {inproceedings}

}
2014
Paul Klemm, Lisa Frauenstein, David Perlich, Katrin Hegenscheid, Henry Völzke, Bernhard Preim
Clustering Socio-demographic and Medical Attribute Data in Cohort Studies Proceedings Article
In: Bildverarbeitung für die Medizin (BVM), pp. 180–185, 2014.
@inproceedings{Klemm_2014_BVM,

title = {Clustering Socio-demographic and Medical Attribute Data in Cohort Studies},

author = {Paul Klemm and Lisa Frauenstein and David Perlich and Katrin Hegenscheid and Henry Völzke and Bernhard Preim},

url = {https://www.vismd.de/wp-content/uploads/legacy/klemm_2014_bvm.pdf, PDF Download},

year  = {2014},

date = {2014-01-01},

booktitle = {Bildverarbeitung für die Medizin (BVM)},

pages = {180--185},

keywords = {},

pubstate = {published},

tppubtype = {inproceedings}

}
Paul Klemm, Steffen Oeltze-Jafra, Kai Lawonn, Katrin Hegenscheid, Henry Völzke, Bernhard Preim
Interactive Visual Analysis of Image-Centric Cohort Study Data Journal Article
In: IEEE Transactions on Visualization and Computer Graphics (TVCG), pp. 1673–1682, 2014.
@article{Klemm_2014_tvcg,

title = {Interactive Visual Analysis of Image-Centric Cohort Study Data},

author = {Paul Klemm and Steffen Oeltze-Jafra and Kai Lawonn and Katrin Hegenscheid and Henry Völzke and Bernhard Preim},

url = {https://www.vismd.de/wp-content/uploads/legacy/klemm_2014_tvcg.pdf, PDF Download},

year  = {2014},

date = {2014-01-01},

journal = {IEEE Transactions on Visualization and Computer Graphics (TVCG)},

pages = {1673--1682},

keywords = {},

pubstate = {published},

tppubtype = {article}

}
P Angelelli, Steffen Oeltze, C Turkay, J Haasz, E Hodneland, Arvid Lundervold, Bernhard Preim, Helwig Hauser
Interactive Visual Analysis of Heterogeneous Cohort Study Data Journal Article
In: IEEE Computer Graphics and Applications, vol. 34(5), no. 5, pp. 70–82, 2014, ISSN: 0272-1716.
@article{Angelelli_2014_CGA,

title = {Interactive Visual Analysis of Heterogeneous Cohort Study Data},

author = {P Angelelli and Steffen Oeltze and C Turkay and J Haasz and E Hodneland and Arvid Lundervold and Bernhard Preim and Helwig Hauser},

url = {https://www.vismd.de/wp-content/uploads/legacy/angelelli_2014_cga.pdf, PDF Download},

doi = {http://dx.doi.org/10.1109/MCG.2014.40},

issn = {0272-1716},

year  = {2014},

date = {2014-01-01},

journal = {IEEE Computer Graphics and Applications},

volume = {34(5)},

number = {5},

pages = {70--82},

keywords = {},

pubstate = {published},

tppubtype = {article}

}
2013
Paul Klemm, Kai Lawonn, Marko Rak, Bernhard Preim, Klaus-Dietz Tönnies, Katrin Hegenscheid, Henry Völzke, Steffen Oeltze
Visualization and Analysis of Lumbar Spine Canal Variability in Cohort Study Data Proceedings Article
In: Favre, Michael Bronstein Jean; Hormann, Kai (Ed.): VMV 2013 - Vision, Modeling, Visualization, pp. 121–128, Lugano, 2013.
@inproceedings{Klemm_2013_VMV,

title = {Visualization and Analysis of Lumbar Spine Canal Variability in Cohort Study Data},

author = {Paul Klemm and Kai Lawonn and Marko Rak and Bernhard Preim and Klaus-Dietz Tönnies and Katrin Hegenscheid and Henry Völzke and Steffen Oeltze},

editor = {Michael Bronstein Jean Favre and Kai Hormann},

url = {https://www.vismd.de/wp-content/uploads/legacy/klemm_2013_vmv.pdf, PDF Download},

year  = {2013},

date = {2013-09-01},

booktitle = {VMV 2013 - Vision, Modeling, Visualization},

pages = {121--128},

address = {Lugano},

keywords = {},

pubstate = {published},

tppubtype = {inproceedings}

}
2012
Paul Klemm, Steffen Oeltze, Katrin Hegenscheid, Henry Völzke, Klaus-Dietz Tönnies, Bernhard Preim
Visualization and Exploration of Shape Variance for the Analysis of Cohort Study Data Proceedings Article
In: VMV 2012 - Vision, Modeling and Visualization, pp. 221–222, 2012.
@inproceedings{Klemm_2012_VMV,

title = {Visualization and Exploration of Shape Variance for the Analysis of Cohort Study Data},

author = {Paul Klemm and Steffen Oeltze and Katrin Hegenscheid and Henry Völzke and Klaus-Dietz Tönnies and Bernhard Preim},

url = {https://www.vismd.de/wp-content/uploads/legacy/klemm_2012_vmv.pdf, PDF Download},

year  = {2012},

date = {2012-01-01},

booktitle = {VMV 2012 - Vision, Modeling and Visualization},

pages = {221--222},

keywords = {},

pubstate = {published},

tppubtype = {inproceedings}

}
Images