In Toponomics, the function protein pattern in cells or tissue (the toponome) is imaged and analyzed for applications in toxicology, new drug development and patient-drug-interaction. The most advanced imaging technique is robot-driven multi-parameter fluorescence microscopy. This technique is capable of co-mapping hundreds of proteins and their distribution and assembly in protein clusters across a cell or tissue sample by running cycles of fluorescence tagging with monoclonal antibodies or other affinity reagents, imaging, and bleaching in situ. The imaging results in complex multi-parameter data composed of one slice or a 3D volume per affinity reagent. Biologists are particularly interested in the localization of co-occurring proteins, the frequency of co-occurrence and the distribution of co-occurring proteins across the cell. The goal of this project is to develop an interactive visual analysis approach which supports the biologists in evaluating the multi-parameter fluorescence microscopy data.
The project is carried out in close collaboration with Walter Schubert and Reyk Hillert from the molecular pattern recognition working group at the University of Magdeburg. The graph-based visual analysis was developed together with Helmut Doleisch and Wolfgang Freiler from CD-adapco, Vienna and implemented within the SimVis framework.
Publications
2014 |
|
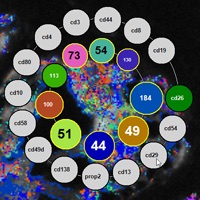 | Interactive Labeling of Toponome Data Inproceedings Proc. of Eurographics Workshop on Visual Computing for Biology and Medicine (EG VCBM), pp. 79–88, Wien, 2014. |
2012 |
|
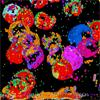 | Visualization and Exploration of 3D Toponome Data Inproceedings VCBM 2012 - Eurographics Workshop on Visual Computing for Biology and Medicine, pp. 115–122, Norrköping, 2012. |
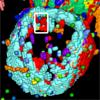 | Visualization and Exploration of 3D Toponome Data Inproceedings 2nd IEEE Symposium on Biological Data Visualization (BioVis), pp. to appear, 2012. |
2011 |
|
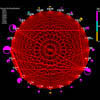 | Interactive, Graph-Based Visual Analysis of High-Dimensional, Multi-Parameter Fluorescence Microscopy Data in Toponomics Journal Article IEEE Transactions on Visualization and Computer Graphics (TVCG), 17(12) , pp. 1882–1891, 2011, (to appear). |
Images
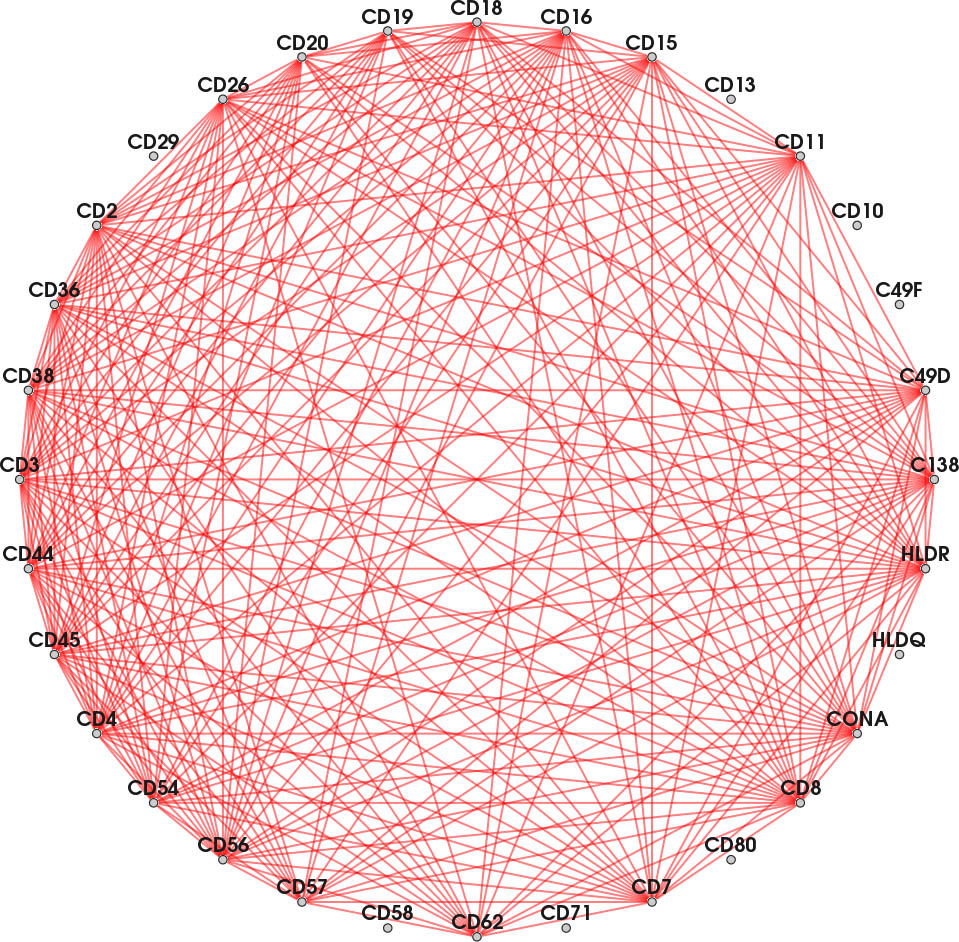
Each node represents a protein affinity reagent. An edge indicates concurrently binding reagents at ≥ one position in the probe. 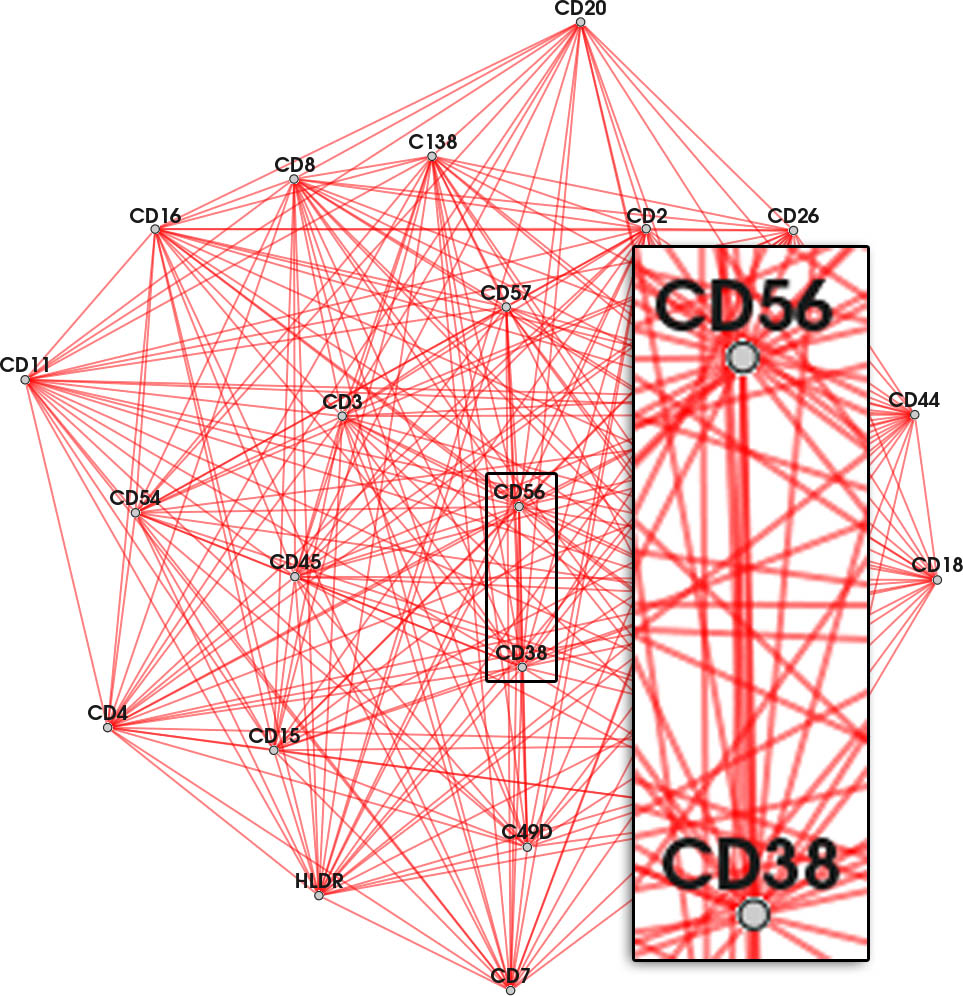
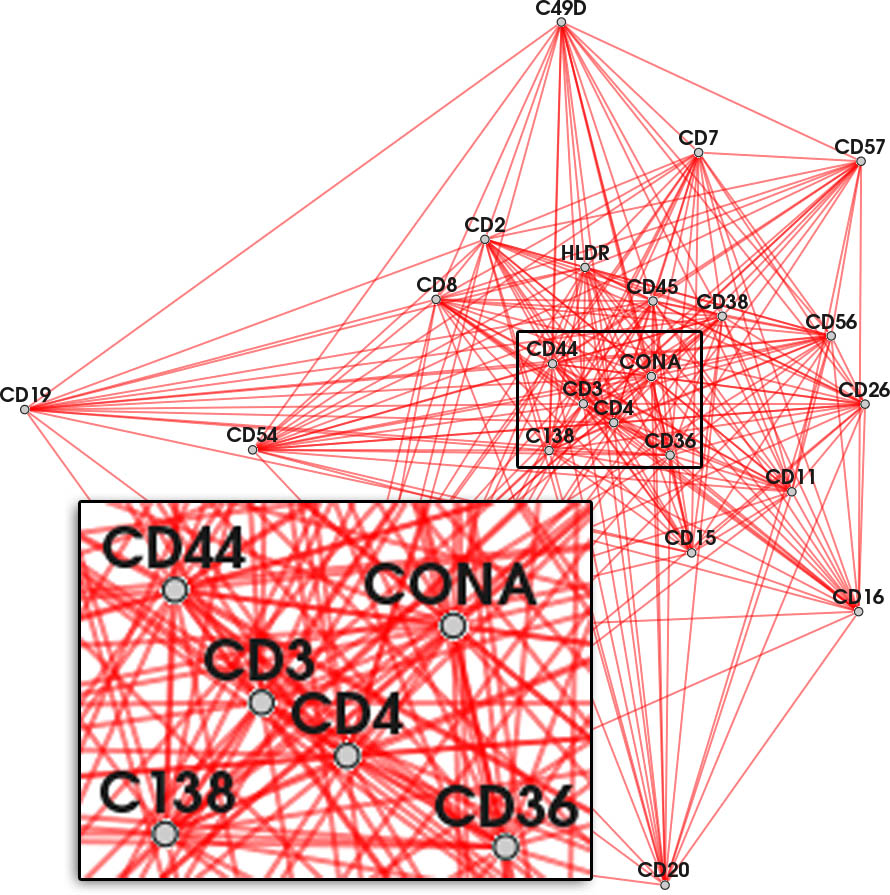
Nodes connected by highly frequent edges are positioned close together. Again, overlapping edges hamper the readability (inset). 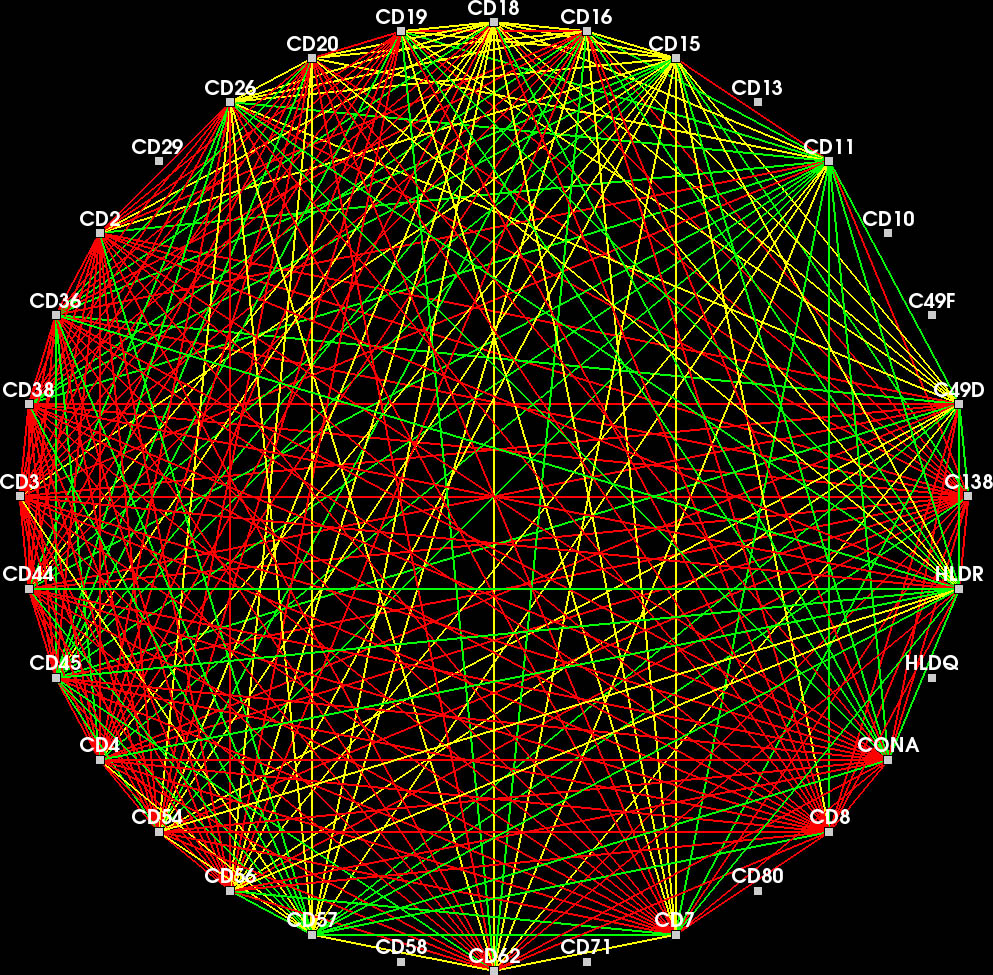
Color encodes whether an edge belongs to the current feature (red), the context (yellow) or another feature in the feature set. 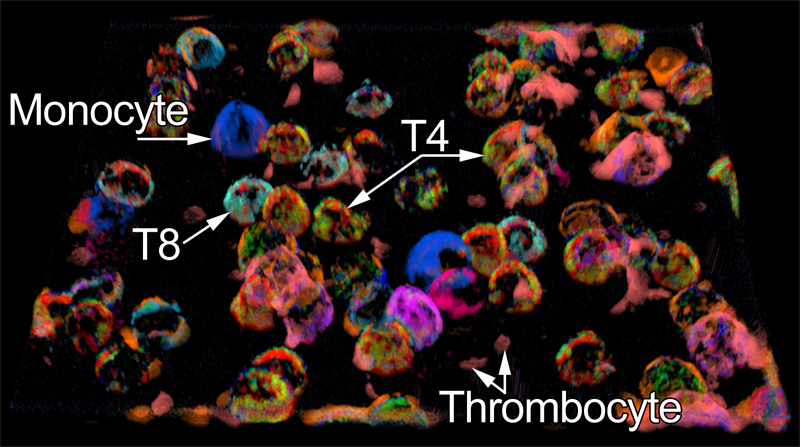
Lymphocyte appear as hemisphere-shaped structures. Co-occuring cell surface proteins are color-coded. Major cell types are annotated. 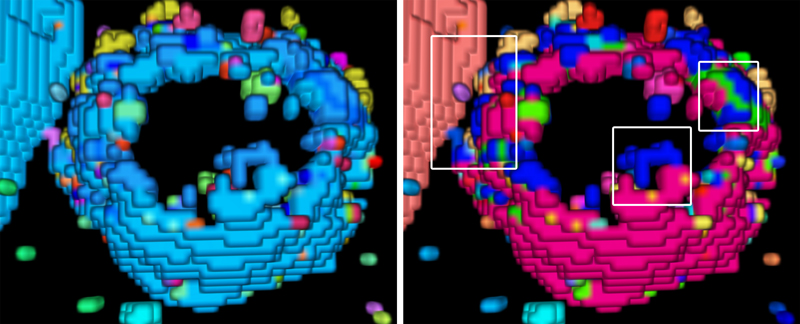
Cell close-ups. Left: A large protein cluster appears turquoise. Right: Optimized coloring reveals the true variety of protein clusters (insets). 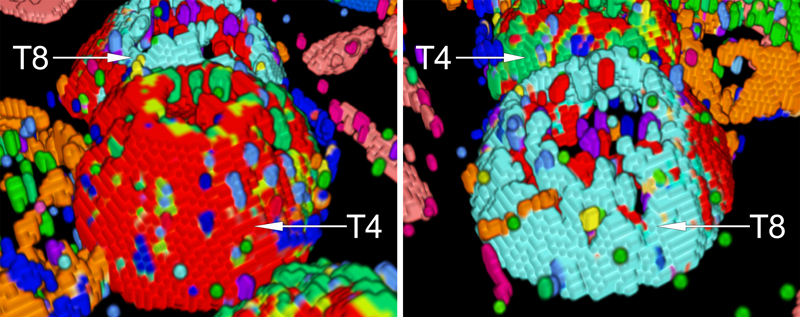
Close-up views of a T4 (left) and a T8 lymphocyte (right). Note the strikingly different cell surface protein clusters. 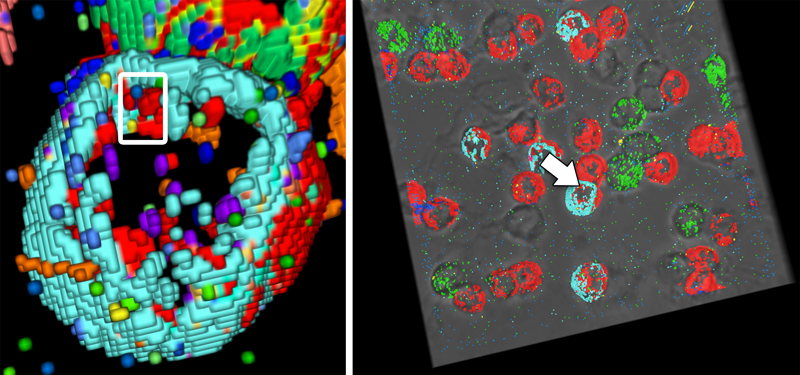
Brushing an interesting part of the cell surface (left) reveals the locations of the brushed protein clusters in the remaining data (right). 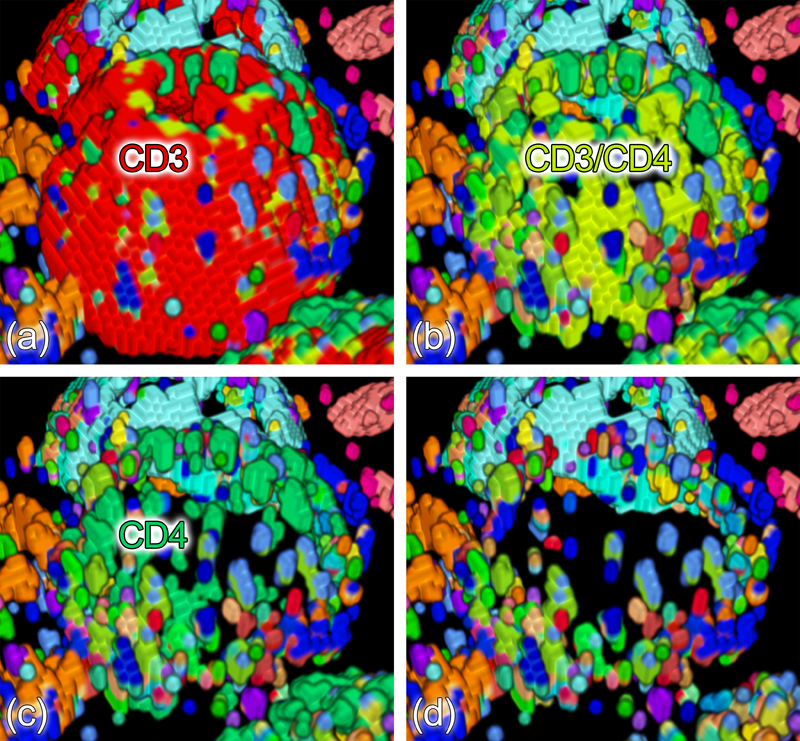
Cell surface protein clusters are peeled off one after another in order to inspect the layered structure of the membrane. 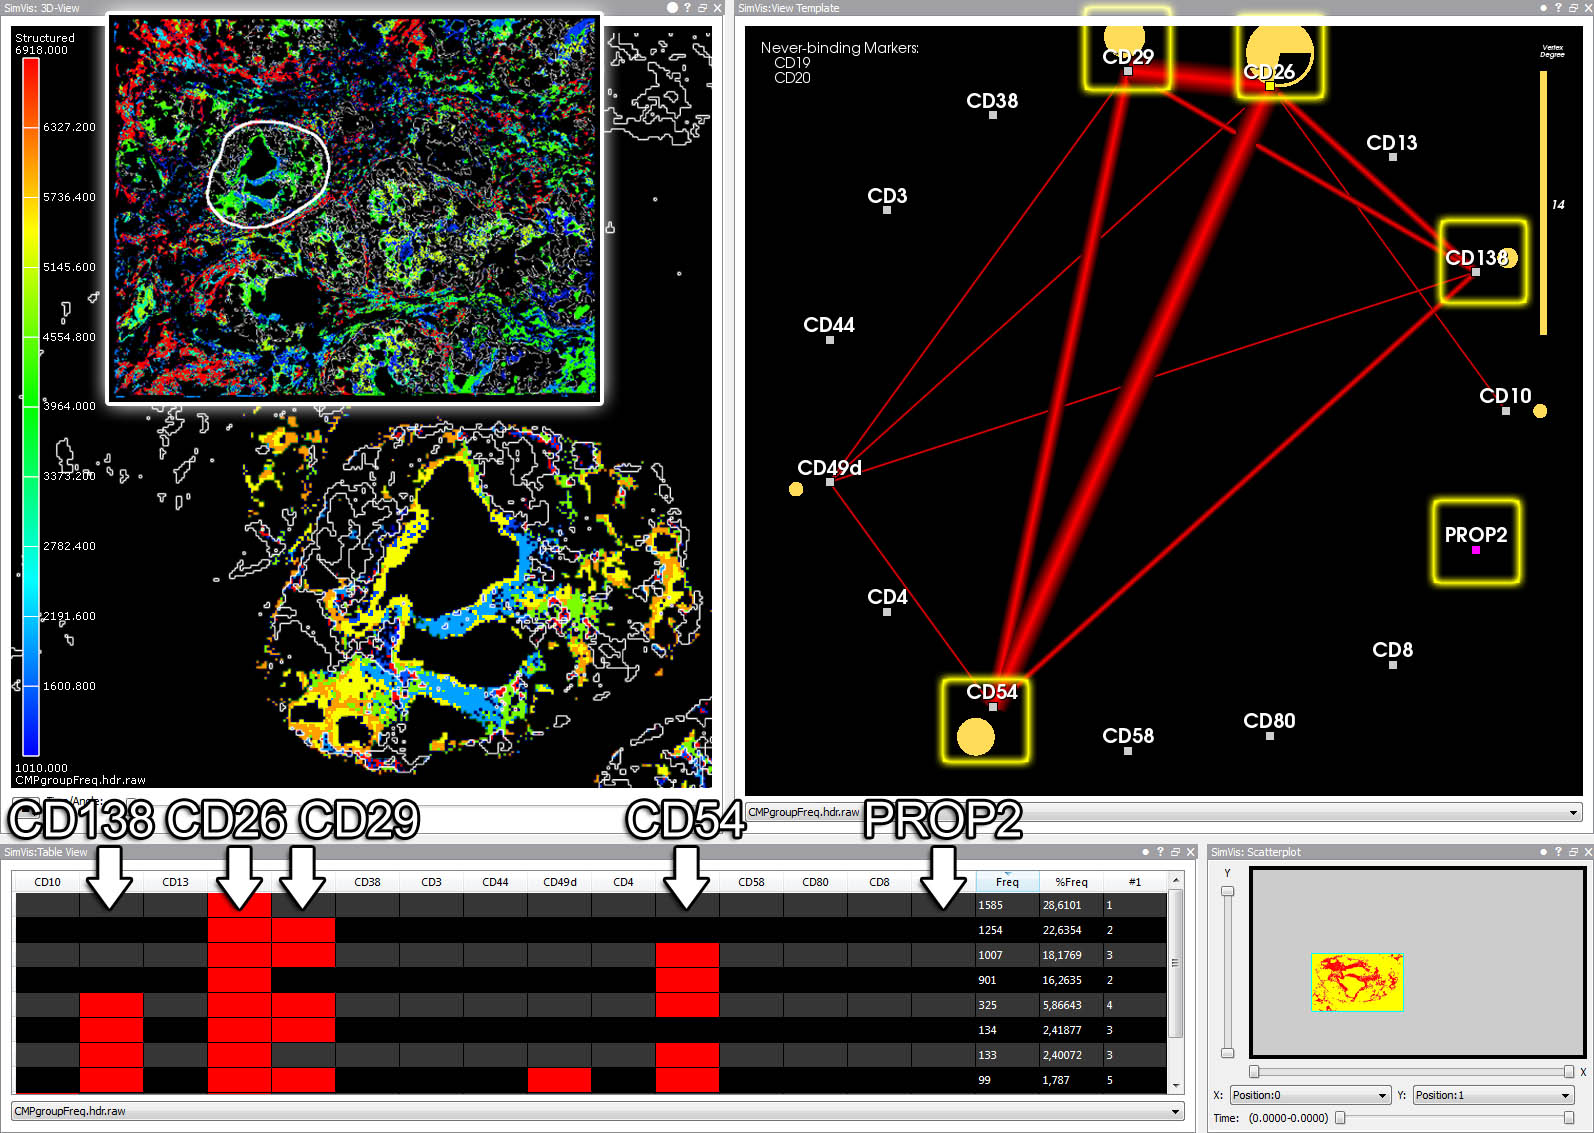
A series of brushing operations in table, scatter plot and graph view isolates a disease specific protein pattern (conveyed by the final graph). 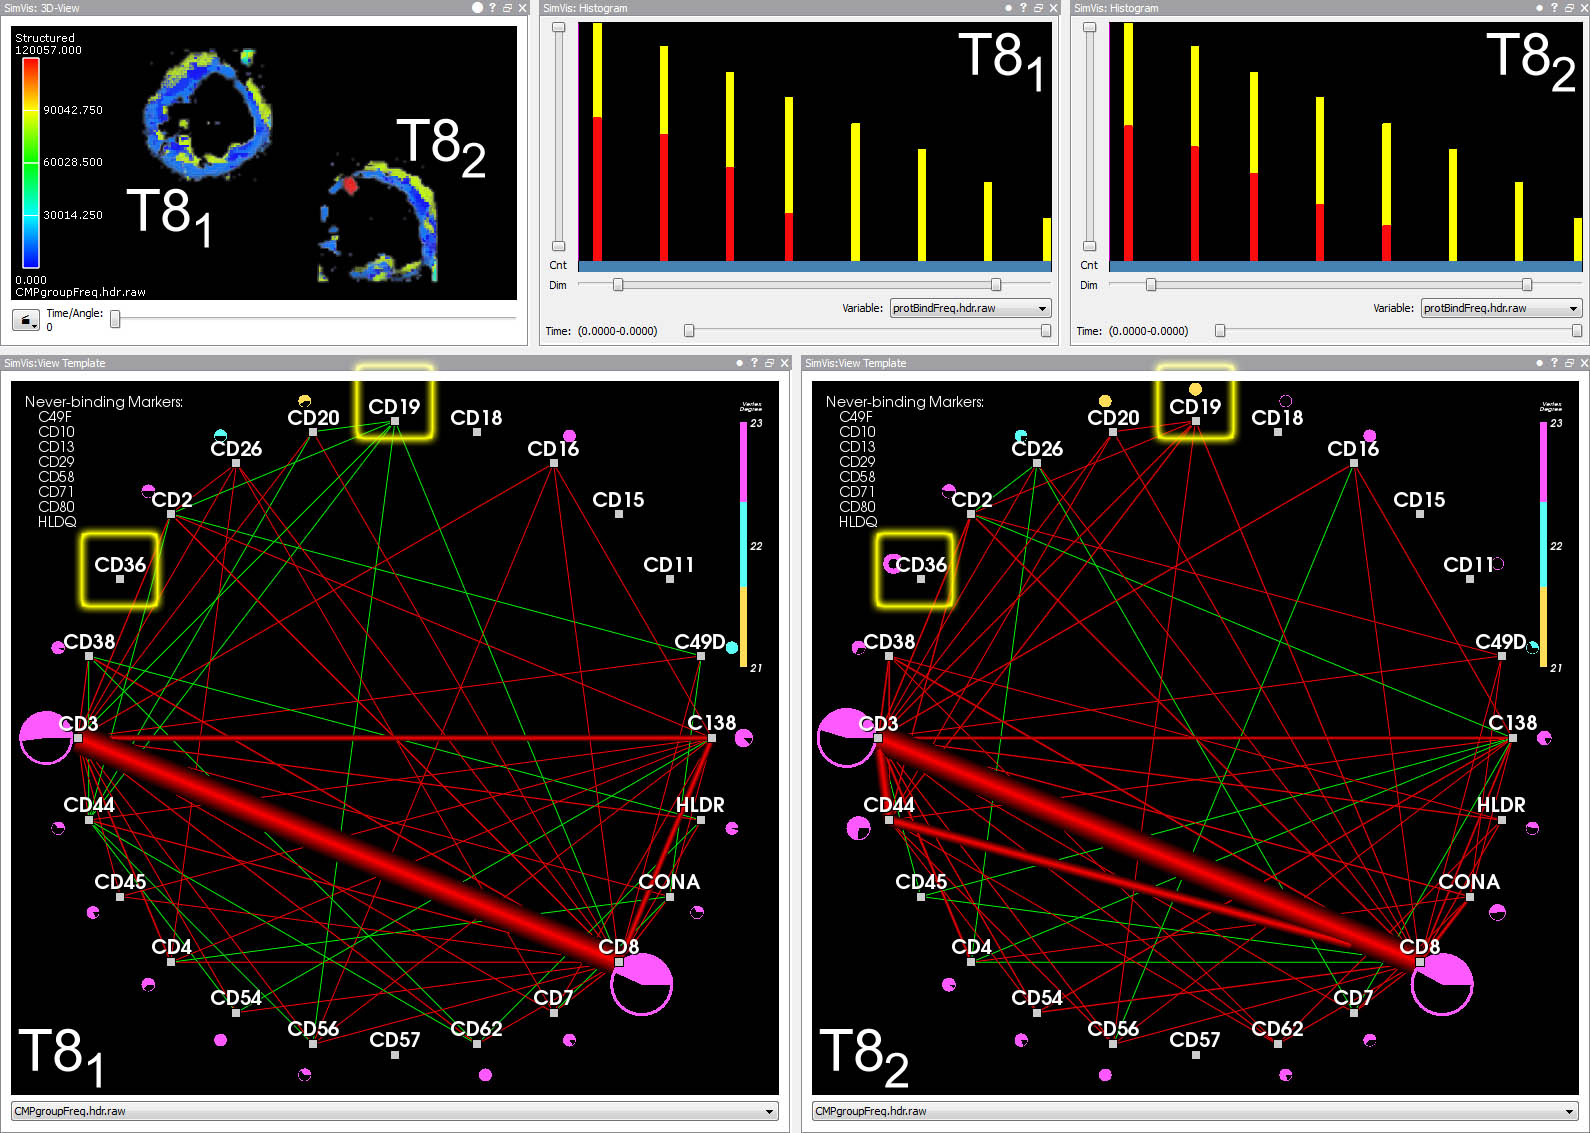
Red edges represent protein affinity reagent bindings existing in both cells. Green edges represent bindings existing only in the other cell. 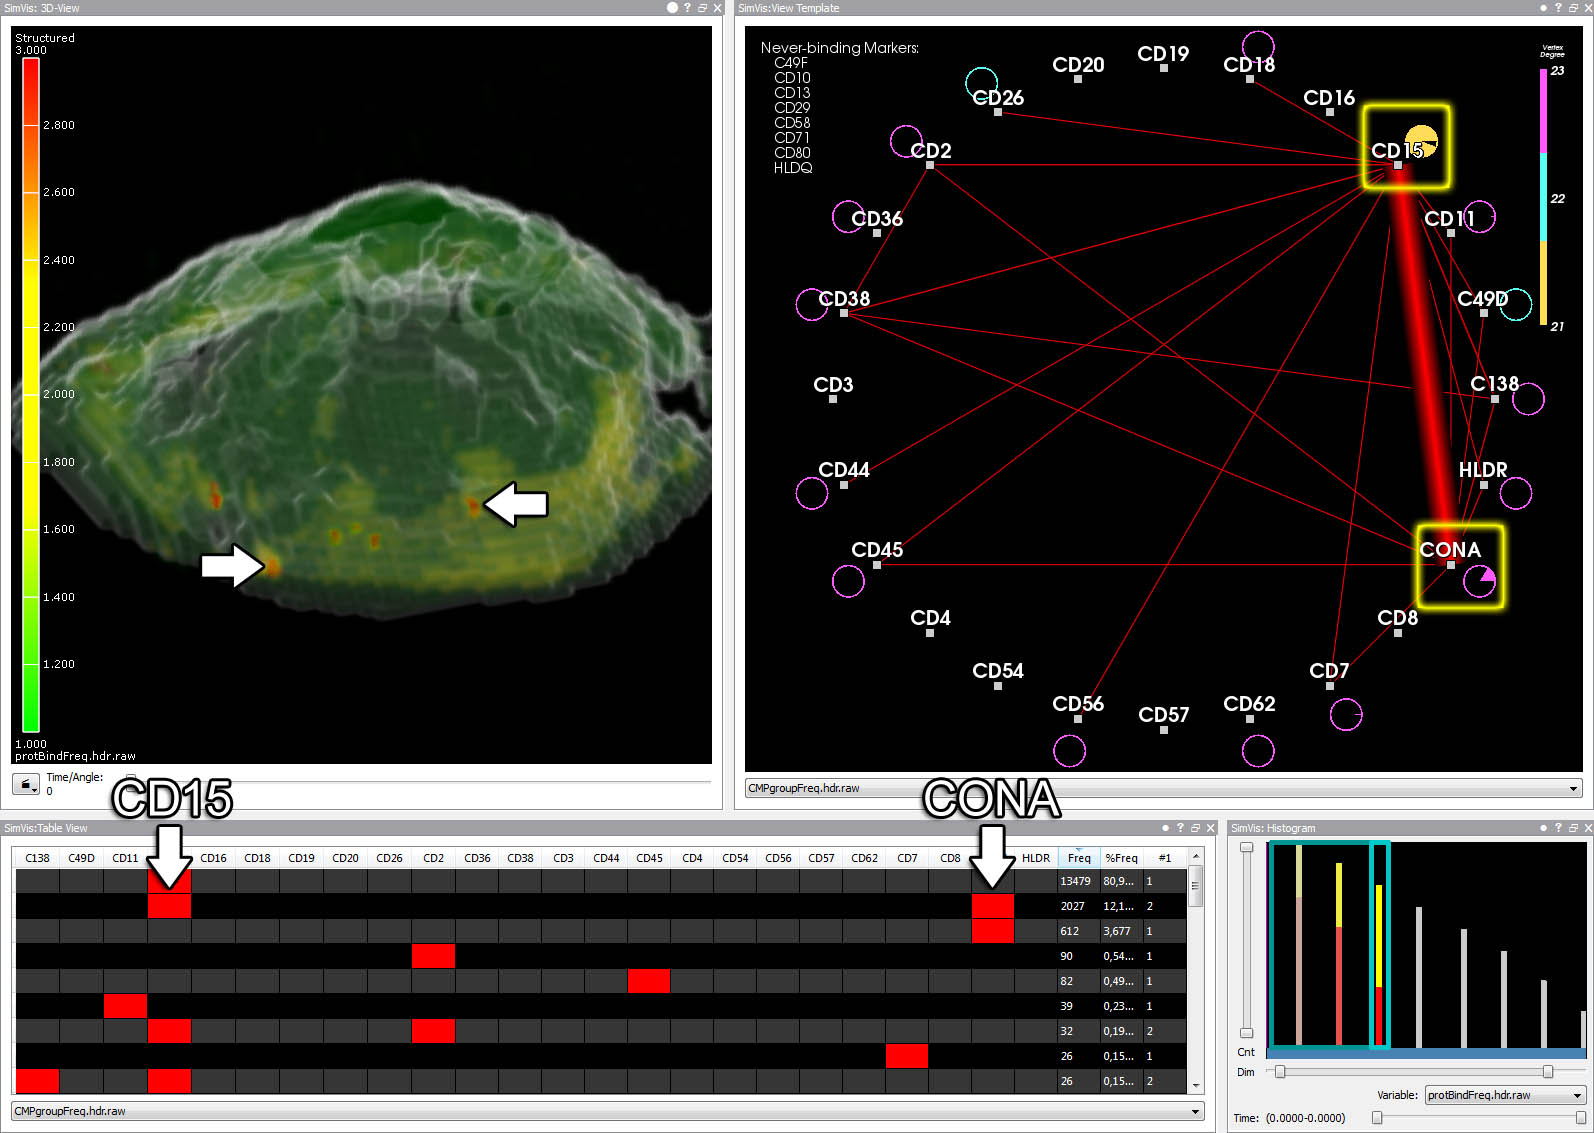
Assigning different RGBA values to voxels with different frequencies of reagent bindings reveals separate clusters within the cell (3D view). 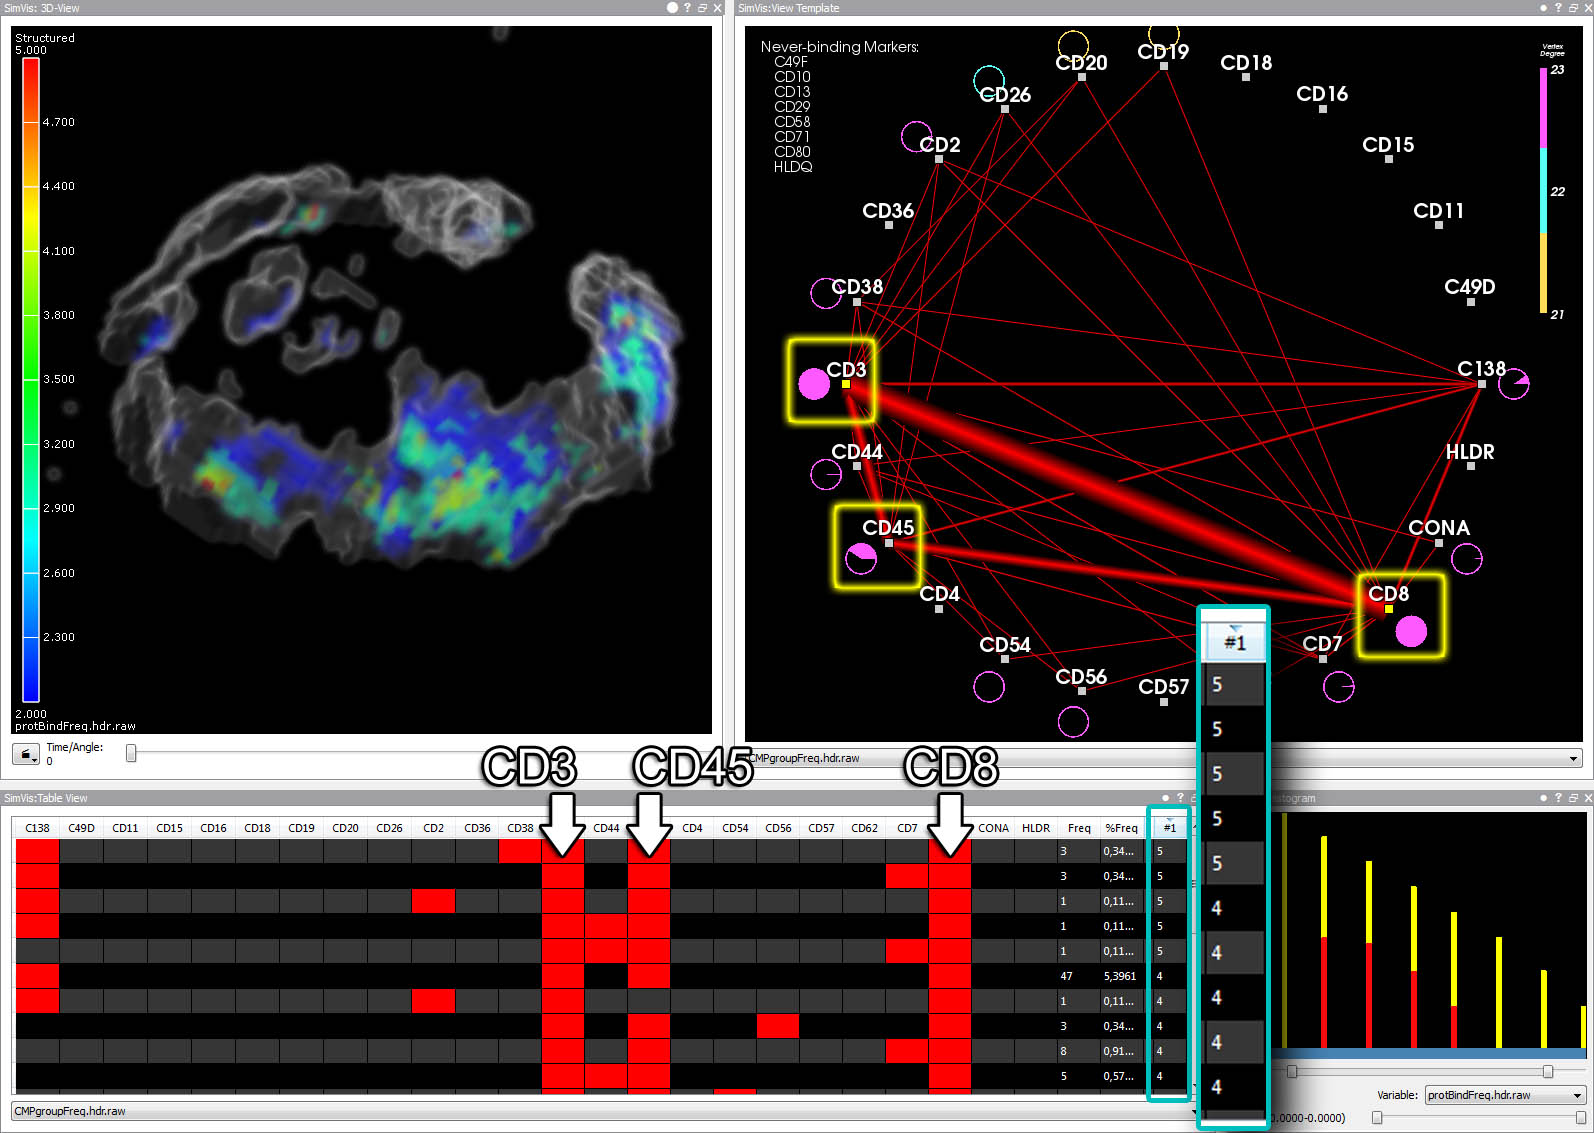
A template CMP has been defined on the graph by brushing nodes. The resulting cell parts are colored in the 3D view. 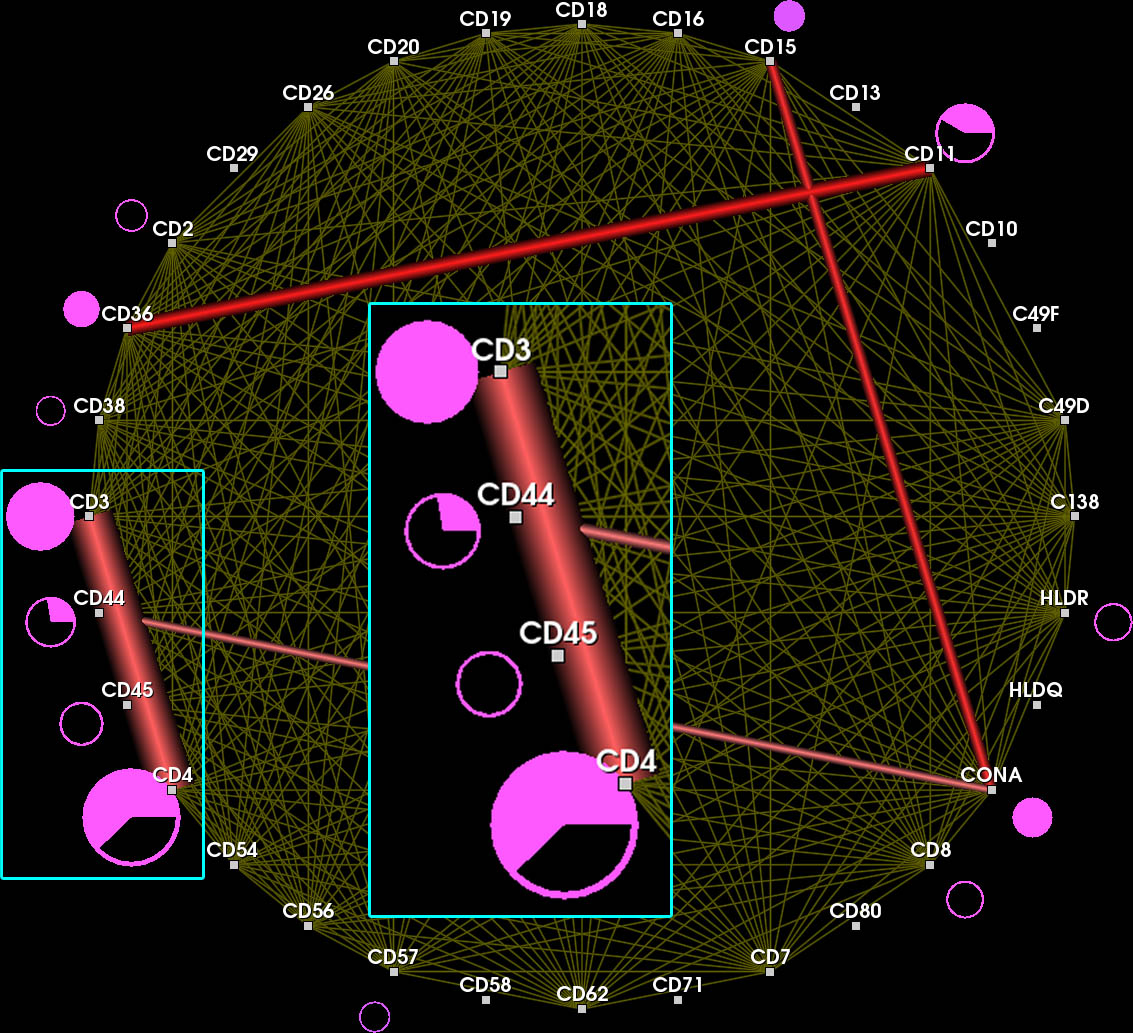
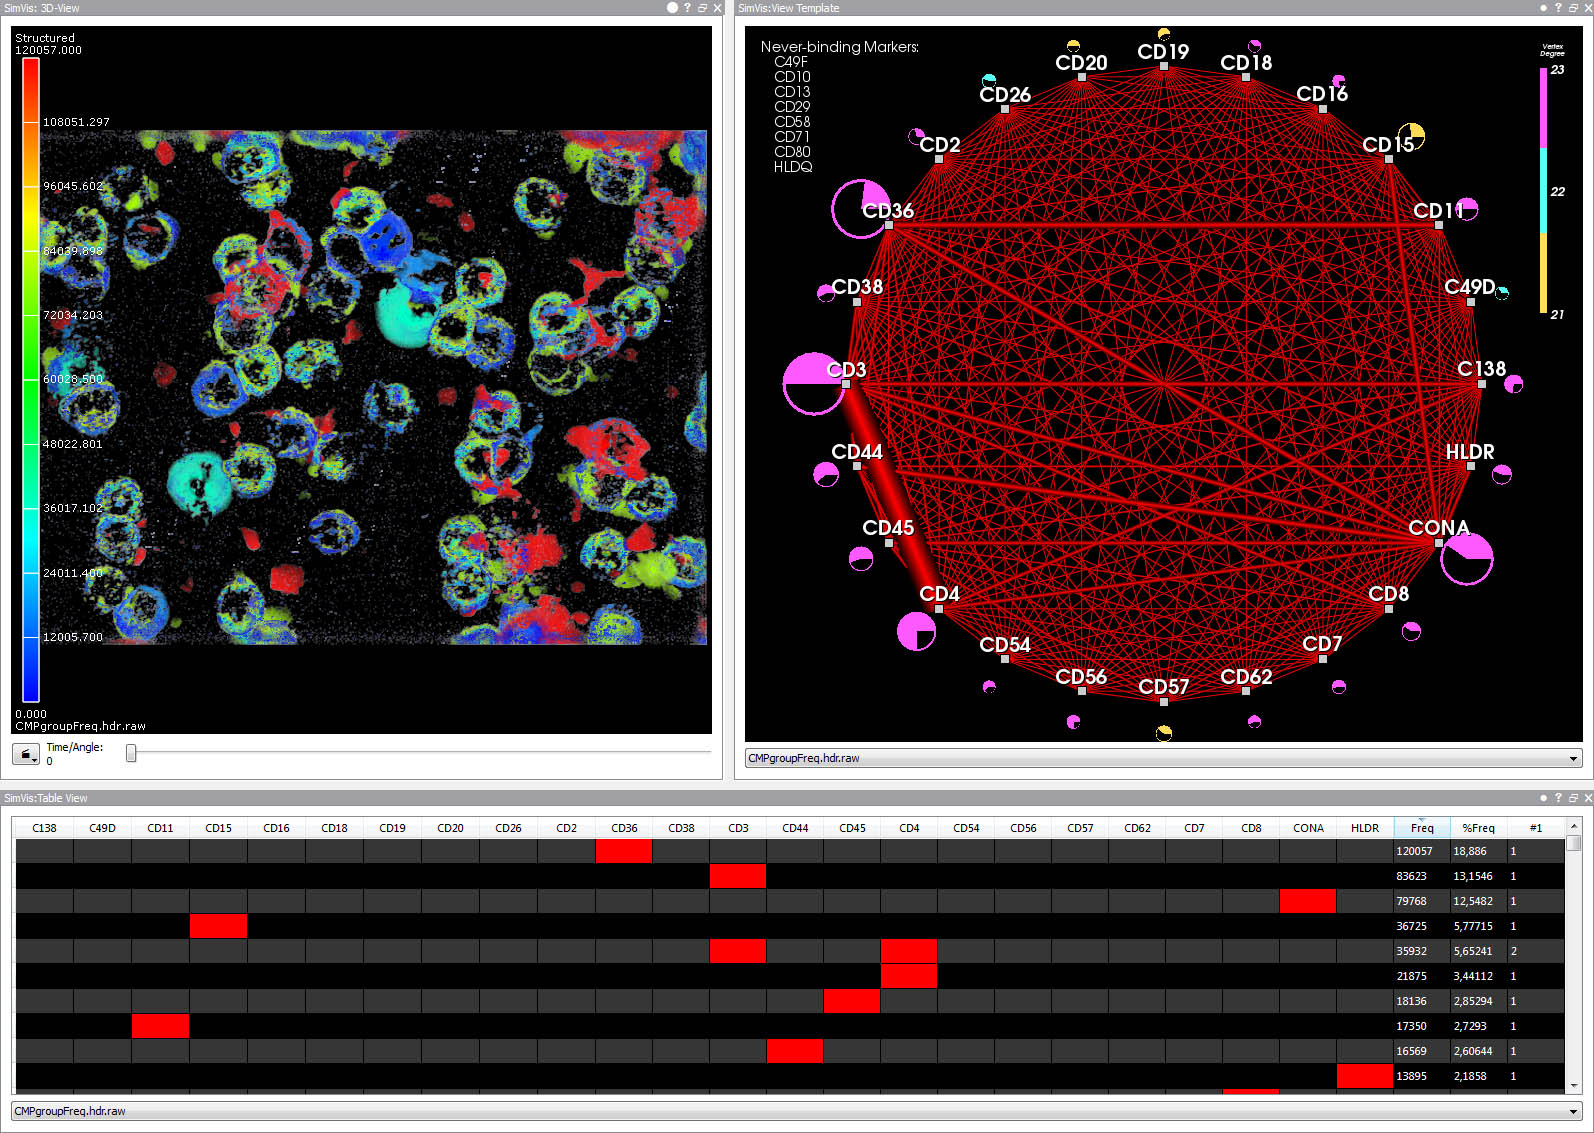
3D view (upper left), graph view (upper right), and table view (bottom). The table summarizes unique fluorescence patterns (CMPs). 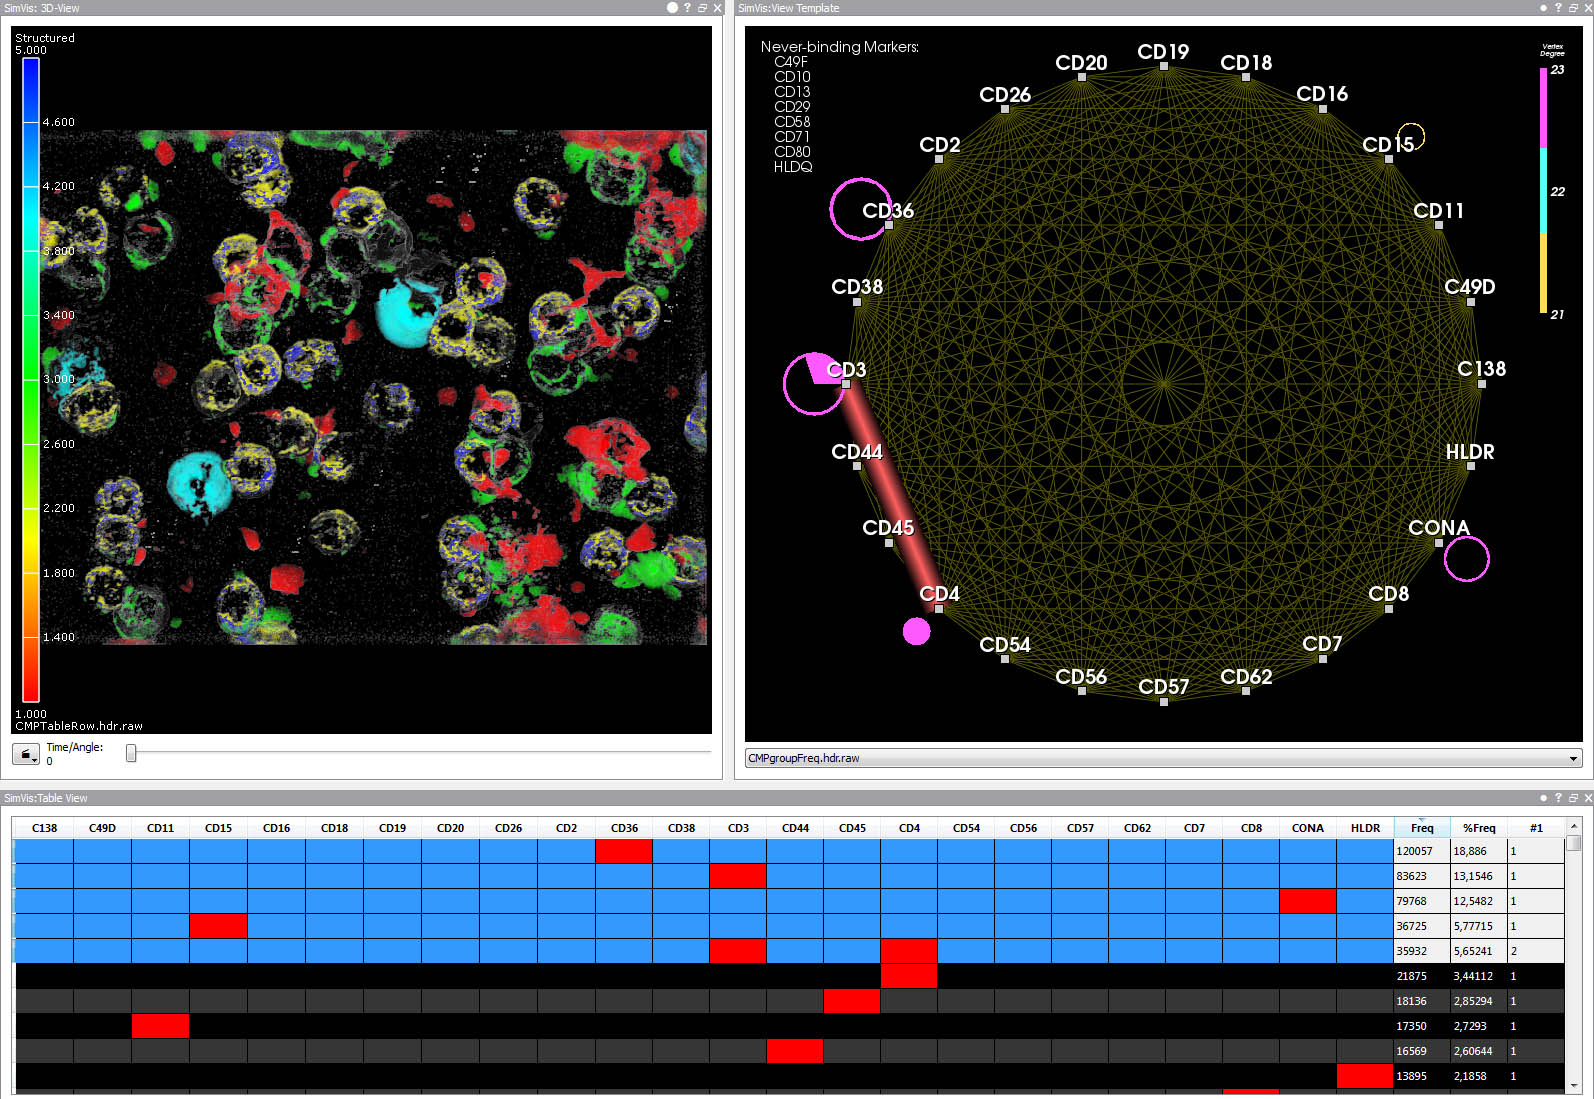
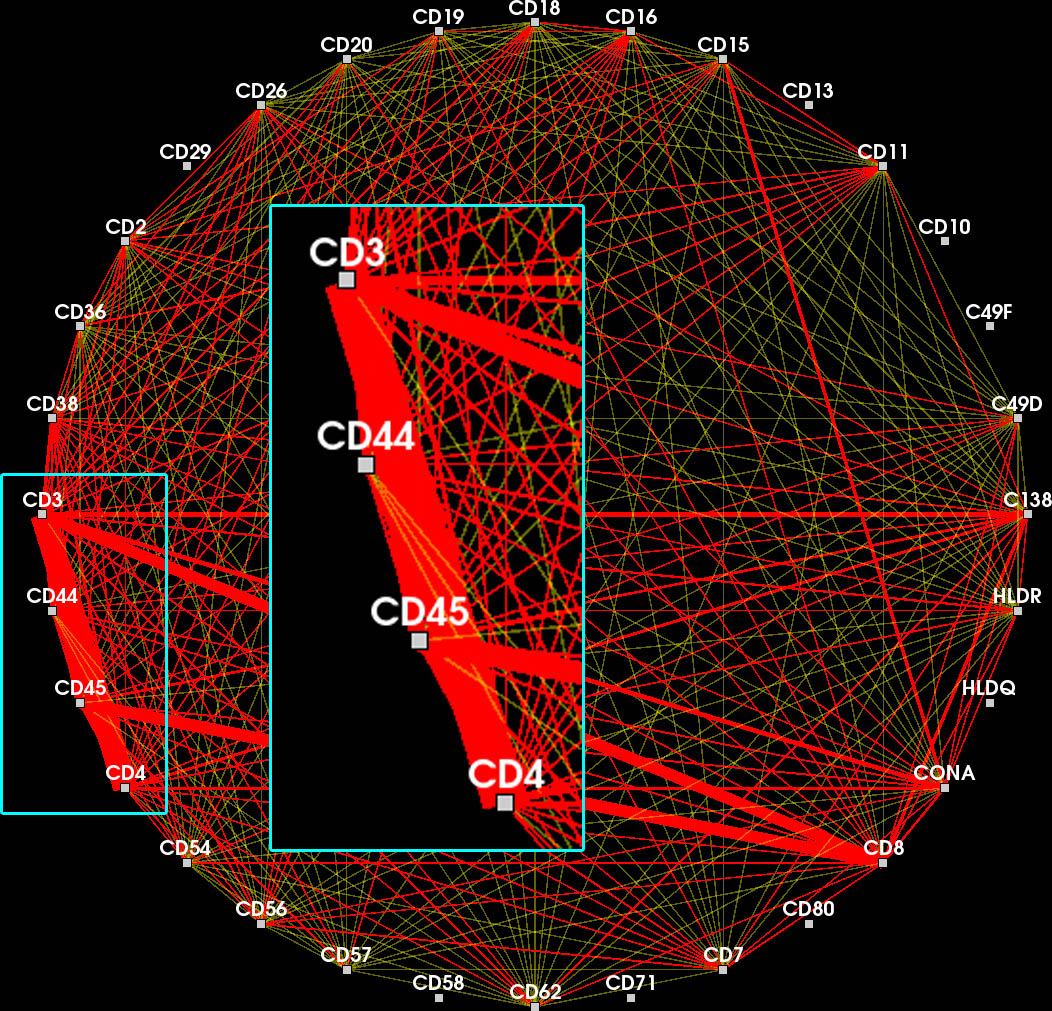
Ribbons encode edge frequency. Overlapping feature edges are difficult to visually separate. Context edges overlay feature edges (inset). 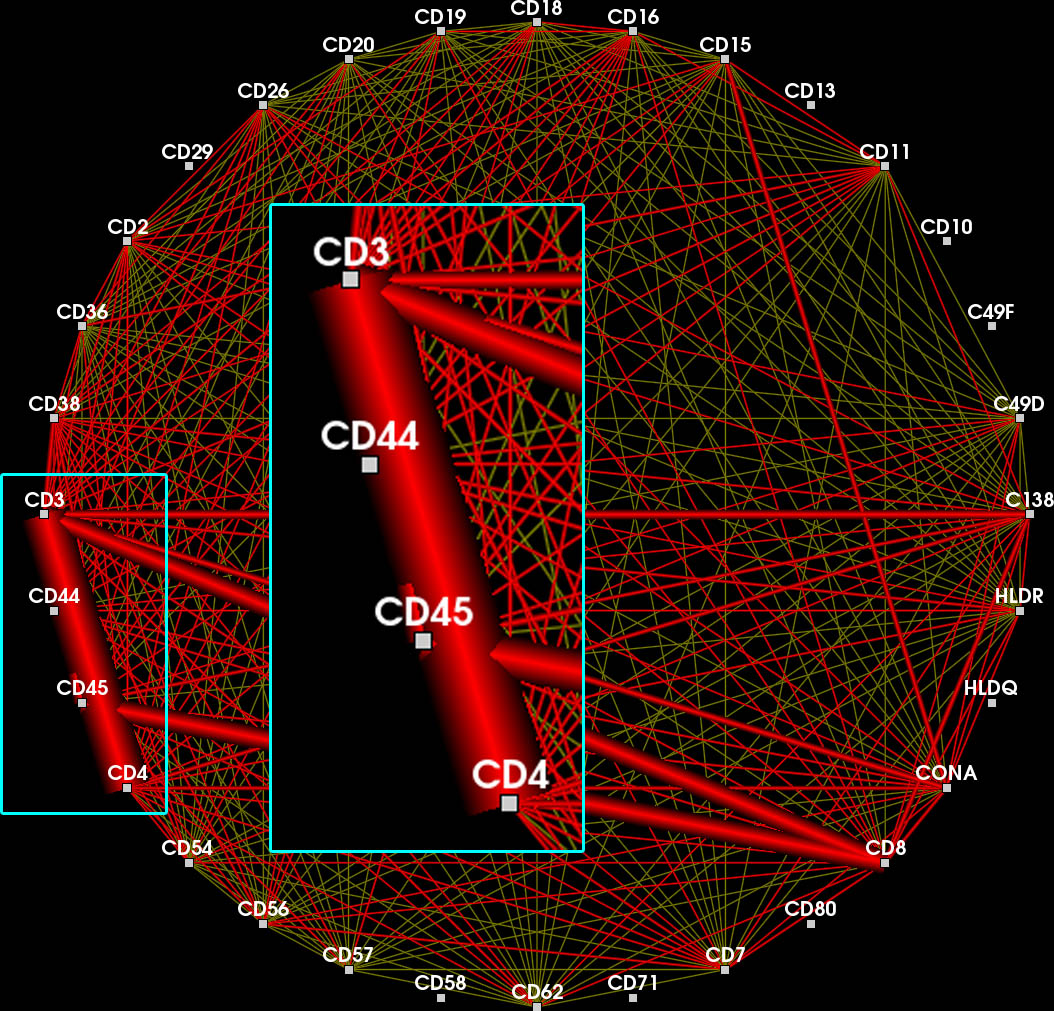
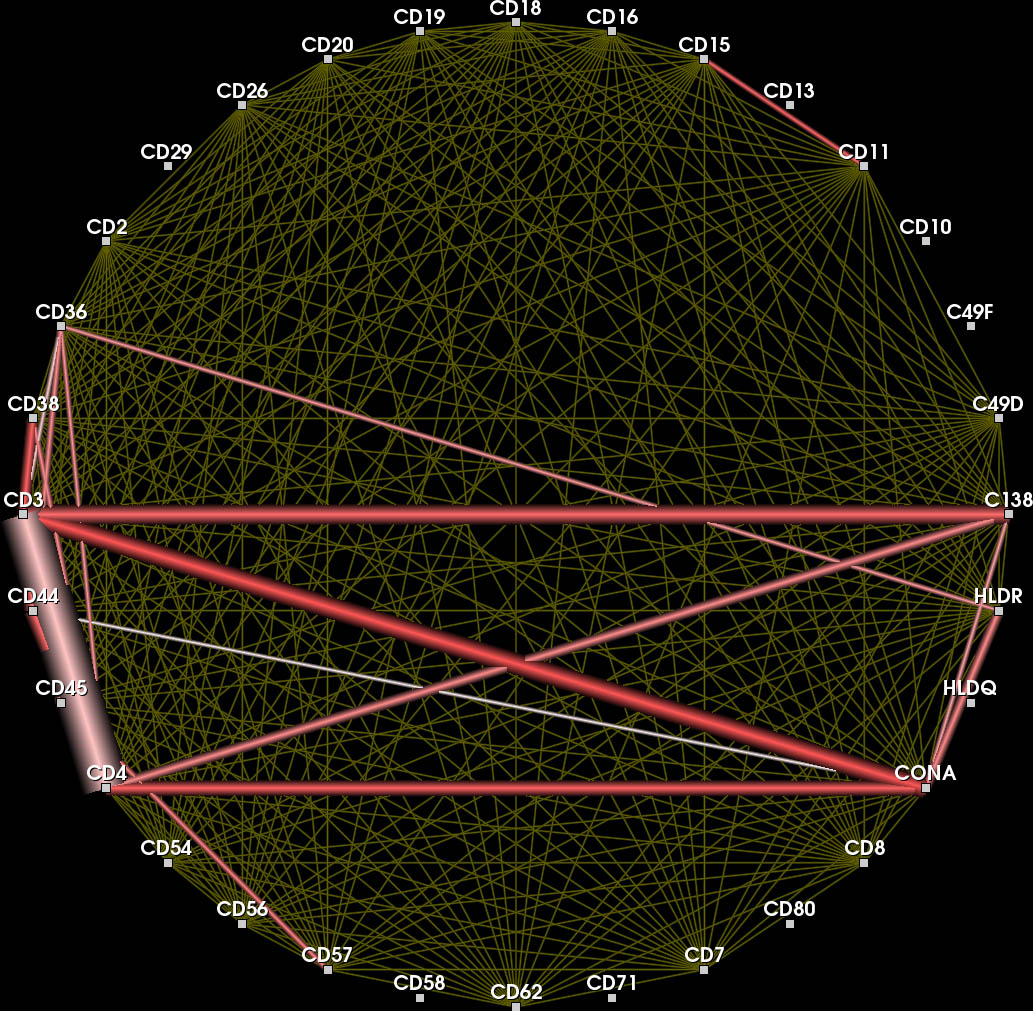
After a feature has been defined, the different shades of red encode the frequency of each contained edge inside and outside of the feature. 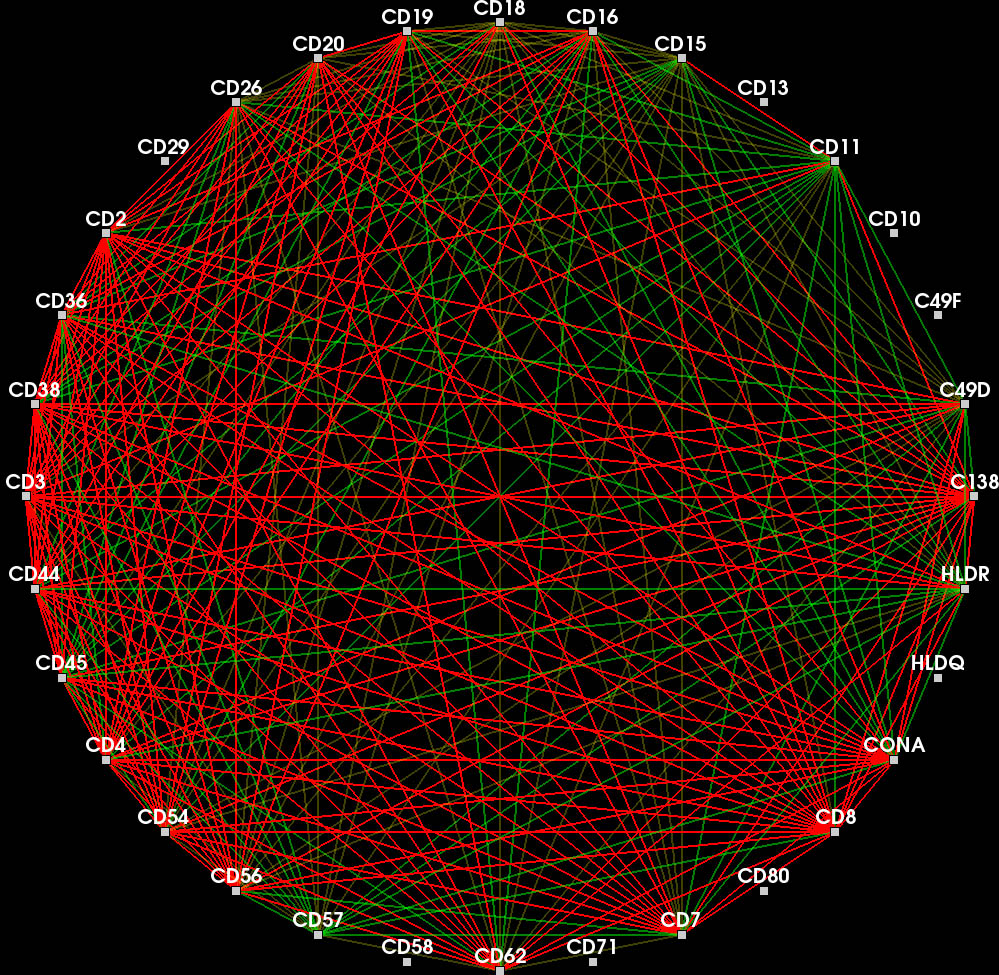
Edge opacity is modulated such that feature edges are emphasized.
