Unlike clinical applications, imaging in community medicine generates large amounts of imaging data from a large number of volunteers, with no specific question in mind for imaging. Analyses are typically performed on a large subject pool. Furthermore, such datasets can be analyzed over very long periods of time, so that analysis results should remain comparable with old studies. For this purpose, it must be guaranteed that the criteria according to which quantitative results are generated in the context of such an analysis are applied in the same way even after a longer period of time.
The aim of the overall project is to use visual analytics methods instead of many individual analysis methods for different questions in order to adapt a small pool of methods to the different questions using expert knowledge. The project goal of the Image Processing / Image Understanding WG in this project is to investigate and develop adaptable geometric models to represent shape and appearance for object detection in MR images. Suitable methods for model-based segmentation will also be investigated. The models should be able to be intuitively generated and parameterized by an image processing layman. We start from the hypothesis that even in the case of structures that are difficult to segment (low or partially non-existent contrast to the background, disturbances due to noise and artifacts), the information in the data is large enough to be successful with a very approximate, geometric model that can be adapted to a variety of tasks by means of a few parameters.
The basis for our work is the hierarchical and non-hierarchical deformable models developed in the research group. The deformability allows the description of patient-independent features of an organ class. It can be varied by a few parameters and describes acceptable variations of shape, appearance and (in the hierarchical variant) configuration of a sought structure. The goal is to find out what is an appropriate representation for inherent variation, what are the limitations of a prototypical model for describing individual variation, how user interaction can be usefully employed to correct model errors, and how models can be optimized (i.e., in a sense, learn) through user interaction without the objectivity of the analysis suffering as a result of the interaction.
Contact
Publications
2019
Bernhard Preim, Shiva Alemzadeh, Till Ittermann, Paul Klemm, Uli Niemann, Myra Spiliopoulou
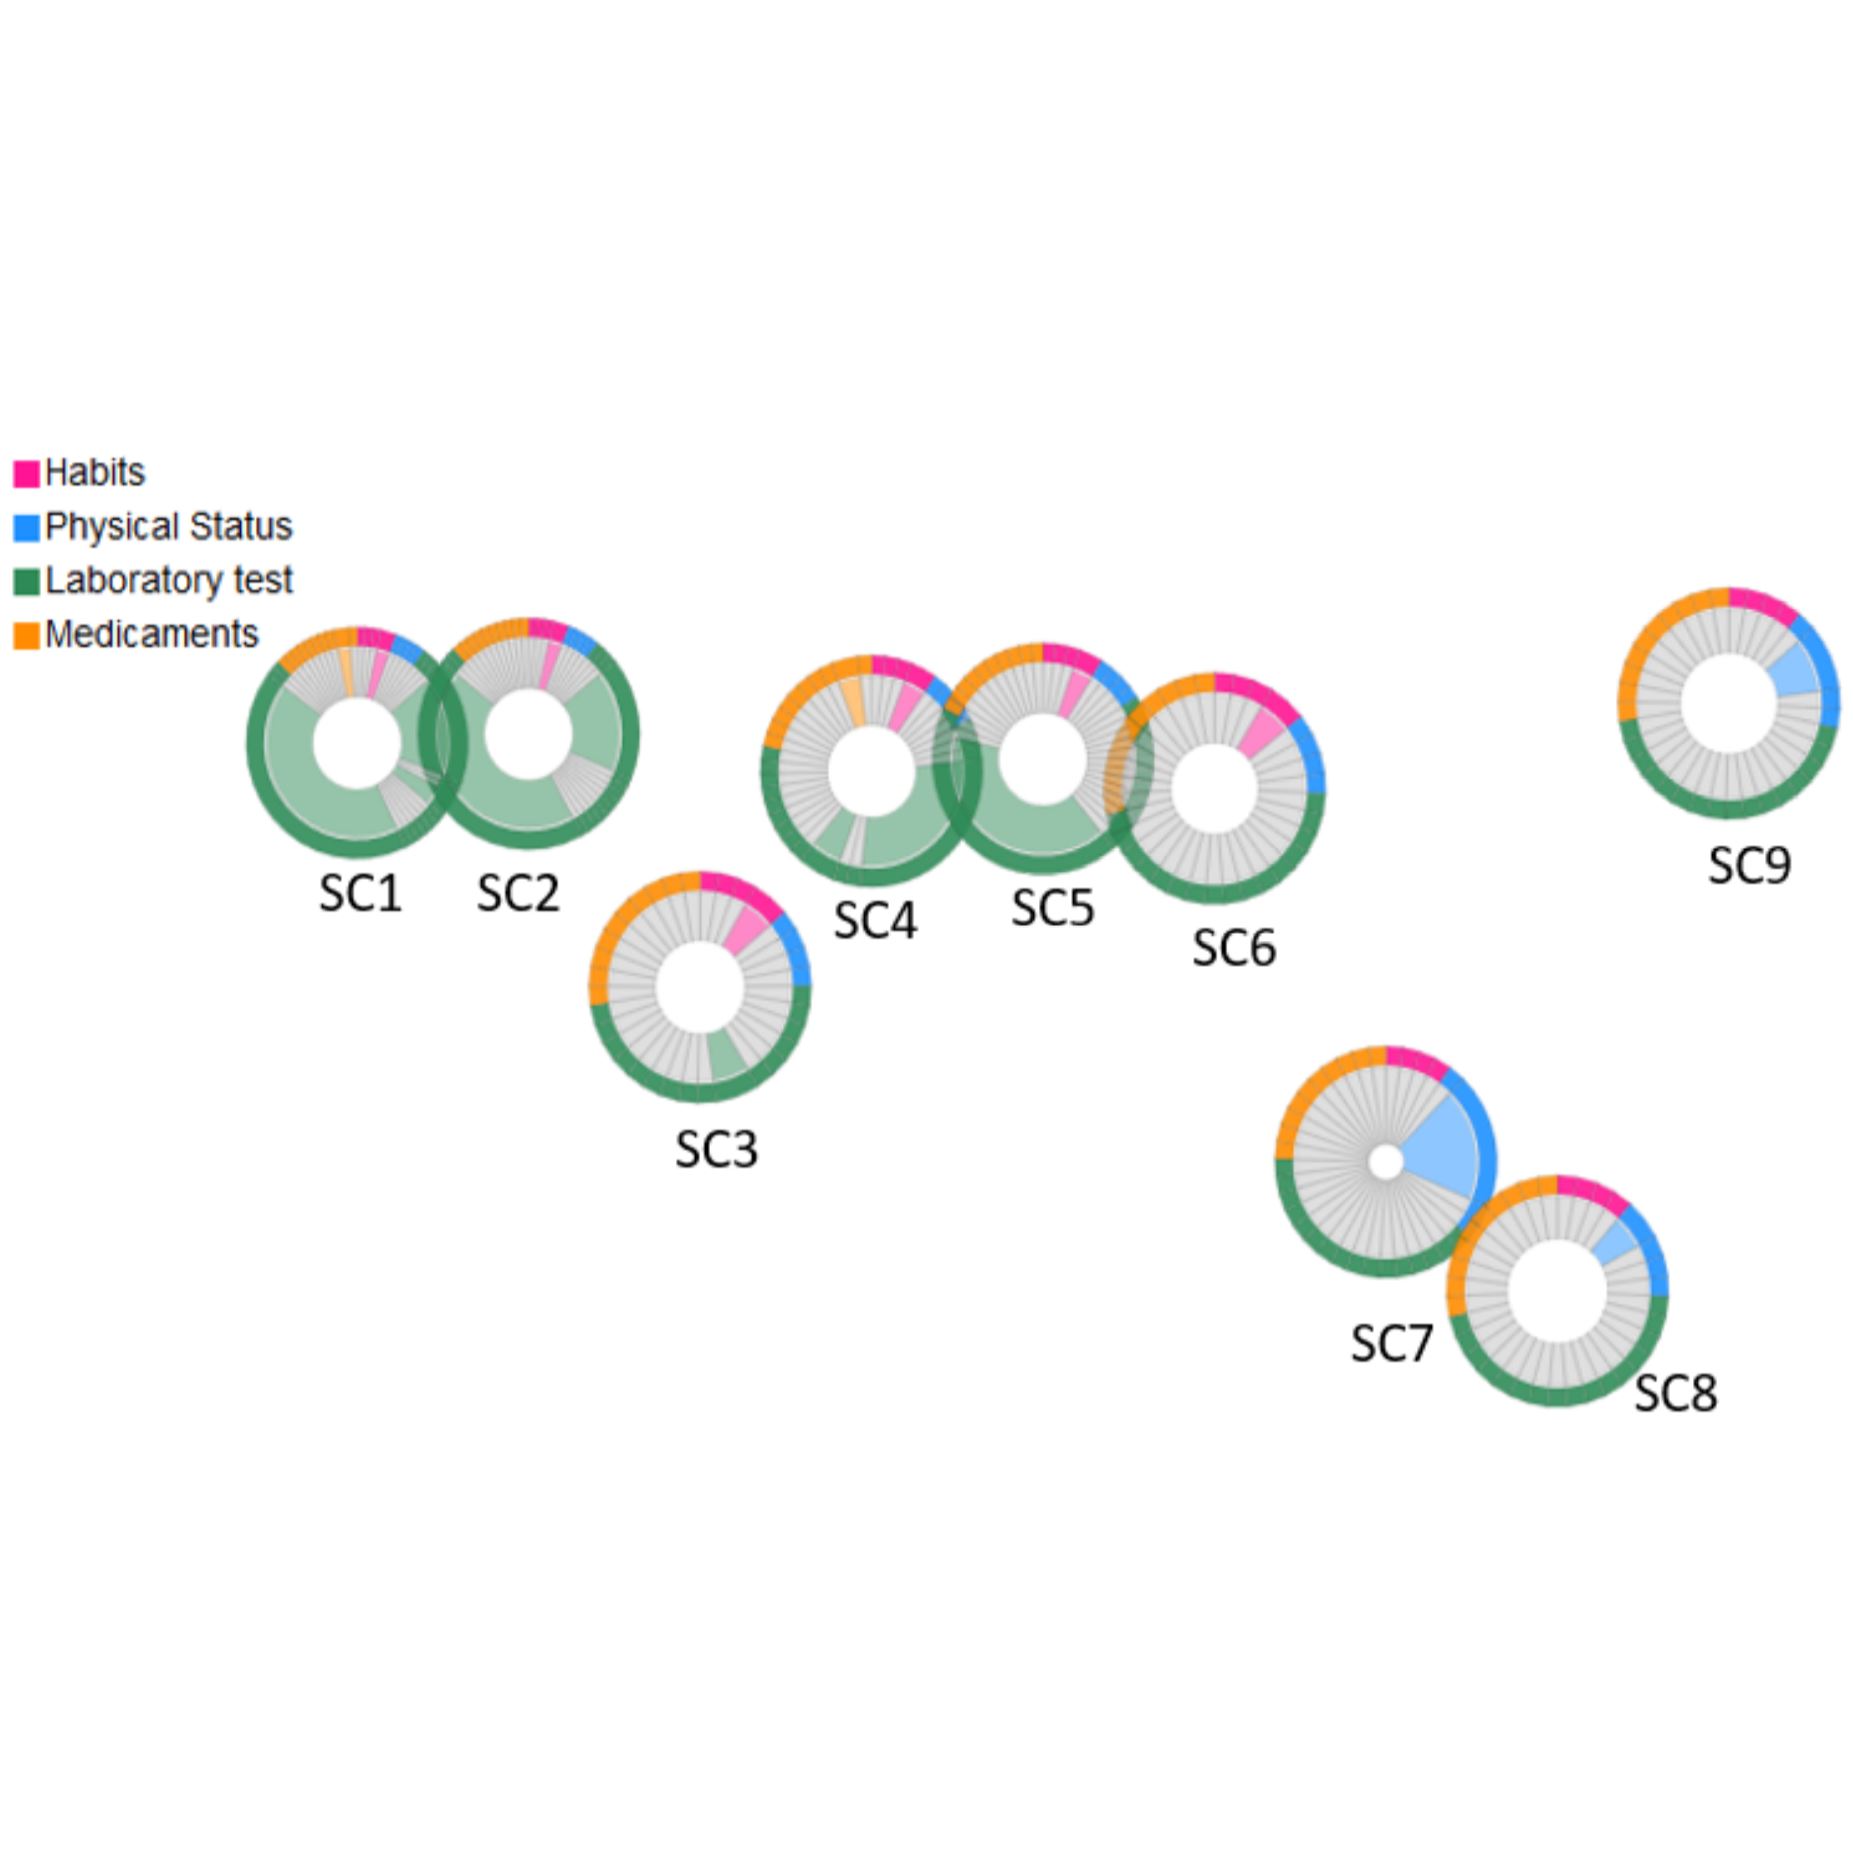
Visual Analytics for Epidemiological Cohort Studies Proceedings Article
In: Proc. of Eurographics Medical Price, 2019.
@inproceedings{Preim_2019_MedP,

title = {Visual Analytics for Epidemiological Cohort Studies},

author = {Bernhard Preim and Shiva Alemzadeh and Till Ittermann and Paul Klemm and Uli Niemann and Myra Spiliopoulou},

url = {https://www.vismd.de/wp-content/uploads/legacy/preim_2019_medp.pdf, PDF Download},

year  = {2019},

date = {2019-01-01},

booktitle = {Proc. of Eurographics Medical Price},

keywords = {},

pubstate = {published},

tppubtype = {inproceedings}

}
2016
Paul Klemm
Interactive Visual Analysis of Population Study Data PhD Thesis
Otto-von-Guericke University Magdeburg, 2016.
@phdthesis{Klemm2016,

title = {Interactive Visual Analysis of Population Study Data},

author = {Paul Klemm},

url = {https://www.vismd.de/wp-content/uploads/legacy/klemm2016.pdf, PDF Download},

year  = {2016},

date = {2016-01-01},

school = {Otto-von-Guericke University Magdeburg},

keywords = {},

pubstate = {published},

tppubtype = {phdthesis}

}
2015
Paul Klemm, Kai Lawonn, Sylvia Glaßer, Uli Niemann, Katrin Hegenscheid, Henry Völzke, Bernhard Preim
3D Regression Heat Map Analysis of Population Study Data Journal Article
In: IEEE Transactions on Visualization and Computer Graphics (TVCG), vol. 22 (1), no. 1, pp. 81–90, 2015.
@article{Klemm_2015_TVCG,

title = {3D Regression Heat Map Analysis of Population Study Data},

author = {Paul Klemm and Kai Lawonn and Sylvia Glaßer and Uli Niemann and Katrin Hegenscheid and Henry Völzke and Bernhard Preim},

url = {https://www.vismd.de/wp-content/uploads/legacy/klemm_2015_tvcg.pdf, PDF Download

https://www.youtube.com/watch?v=diSOEGnZJLM, YouTube},

year  = {2015},

date = {2015-01-01},

journal = {IEEE Transactions on Visualization and Computer Graphics (TVCG)},

volume = {22 (1)},

number = {1},

pages = {81--90},

keywords = {},

pubstate = {published},

tppubtype = {article}

}
Klaus-Dietz Tönnies, Oliver Gloger, Marko Rak, Charlotte Winkler, Paul Klemm, Bernhard Preim, Henry Völzke
Image analysis in epidemiological applications Journal Article
In: it - Information Technology, vol. 57, no. 1, pp. 22–29, 2015.
@article{toennies_2015_it,

title = {Image analysis in epidemiological applications},

author = {Klaus-Dietz Tönnies and Oliver Gloger and Marko Rak and Charlotte Winkler and Paul Klemm and Bernhard Preim and Henry Völzke},

url = {https://www.vismd.de/wp-content/uploads/legacy/toennies_2015_it.pdf, PDF Download},

doi = {10.1515/itit-2014-1071},

year  = {2015},

date = {2015-01-01},

journal = {it - Information Technology},

volume = {57},

number = {1},

pages = {22--29},

keywords = {},

pubstate = {published},

tppubtype = {article}

}
Paul Klemm, Sylvia Glaßer, Kai Lawonn, Marko Rak, Henry Völzke, Katrin Hegenscheid, Bernhard Preim
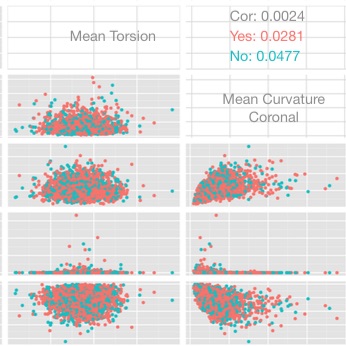
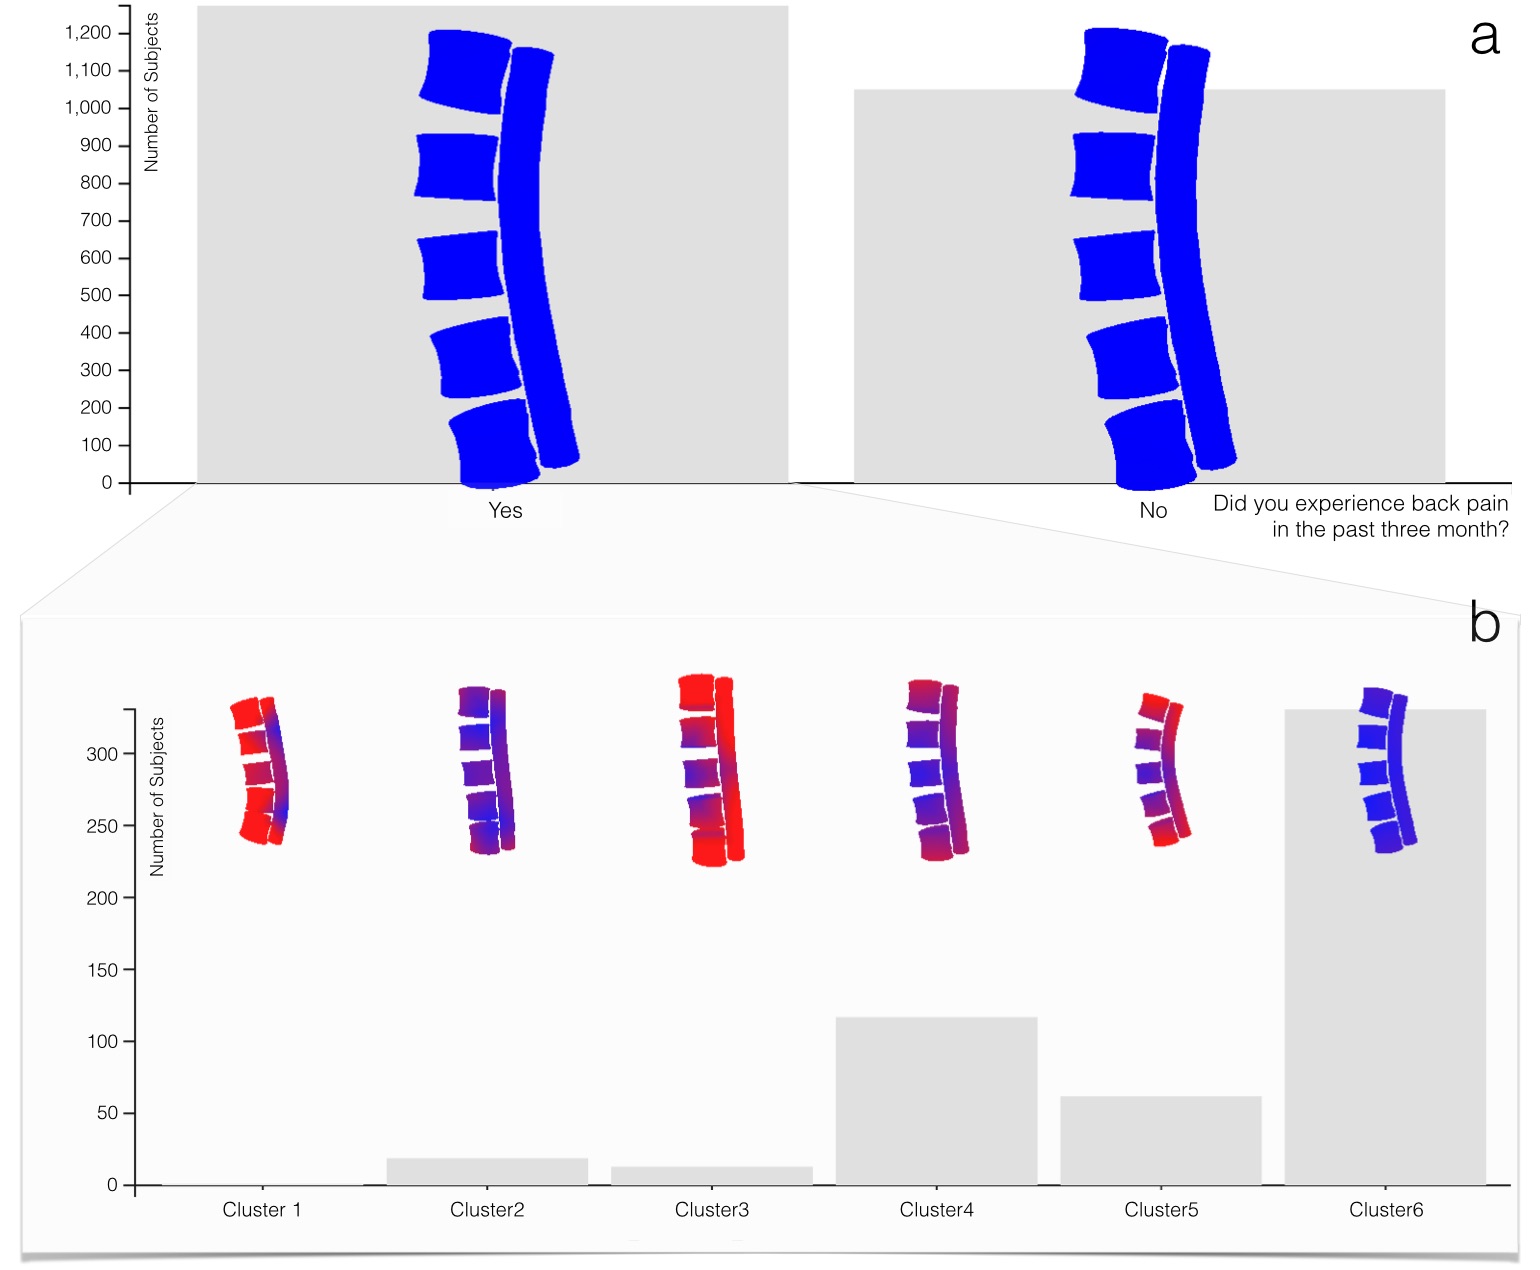
Interactive Visual Analysis of Lumbar Back Pain Proceedings Article
In: Proc. of the 6th International Conference on Information Visualization Theory and Applications (IVAPP), pp. 85–92, Berlin, 2015.
@inproceedings{klemm_2015_ivapp,

title = {Interactive Visual Analysis of Lumbar Back Pain},

author = {Paul Klemm and Sylvia Glaßer and Kai Lawonn and Marko Rak and Henry Völzke and Katrin Hegenscheid and Bernhard Preim},

url = {https://www.vismd.de/wp-content/uploads/legacy/klemm_2015_ivapp.pdf, PDF Download},

year  = {2015},

date = {2015-00-01},

booktitle = {Proc. of the 6th International Conference on Information Visualization Theory and Applications (IVAPP)},

pages = {85--92},

address = {Berlin},

keywords = {},

pubstate = {published},

tppubtype = {inproceedings}

}
2014
Paul Klemm, Lisa Frauenstein, David Perlich, Katrin Hegenscheid, Henry Völzke, Bernhard Preim
Clustering Socio-demographic and Medical Attribute Data in Cohort Studies Proceedings Article
In: Bildverarbeitung für die Medizin (BVM), pp. 180–185, 2014.
@inproceedings{Klemm_2014_BVM,

title = {Clustering Socio-demographic and Medical Attribute Data in Cohort Studies},

author = {Paul Klemm and Lisa Frauenstein and David Perlich and Katrin Hegenscheid and Henry Völzke and Bernhard Preim},

url = {https://www.vismd.de/wp-content/uploads/legacy/klemm_2014_bvm.pdf, PDF Download},

year  = {2014},

date = {2014-01-01},

booktitle = {Bildverarbeitung für die Medizin (BVM)},

pages = {180--185},

keywords = {},

pubstate = {published},

tppubtype = {inproceedings}

}
Paul Klemm, Steffen Oeltze-Jafra, Kai Lawonn, Katrin Hegenscheid, Henry Völzke, Bernhard Preim
Interactive Visual Analysis of Image-Centric Cohort Study Data Journal Article
In: IEEE Transactions on Visualization and Computer Graphics (TVCG), pp. 1673–1682, 2014.
@article{Klemm_2014_tvcg,

title = {Interactive Visual Analysis of Image-Centric Cohort Study Data},

author = {Paul Klemm and Steffen Oeltze-Jafra and Kai Lawonn and Katrin Hegenscheid and Henry Völzke and Bernhard Preim},

url = {https://www.vismd.de/wp-content/uploads/legacy/klemm_2014_tvcg.pdf, PDF Download},

year  = {2014},

date = {2014-01-01},

journal = {IEEE Transactions on Visualization and Computer Graphics (TVCG)},

pages = {1673--1682},

keywords = {},

pubstate = {published},

tppubtype = {article}

}
2013
Paul Klemm, Kai Lawonn, Marko Rak, Bernhard Preim, Klaus-Dietz Tönnies, Katrin Hegenscheid, Henry Völzke, Steffen Oeltze
Visualization and Analysis of Lumbar Spine Canal Variability in Cohort Study Data Proceedings Article
In: Favre, Michael Bronstein Jean; Hormann, Kai (Ed.): VMV 2013 - Vision, Modeling, Visualization, pp. 121–128, Lugano, 2013.
@inproceedings{Klemm_2013_VMV,

title = {Visualization and Analysis of Lumbar Spine Canal Variability in Cohort Study Data},

author = {Paul Klemm and Kai Lawonn and Marko Rak and Bernhard Preim and Klaus-Dietz Tönnies and Katrin Hegenscheid and Henry Völzke and Steffen Oeltze},

editor = {Michael Bronstein Jean Favre and Kai Hormann},

url = {https://www.vismd.de/wp-content/uploads/legacy/klemm_2013_vmv.pdf, PDF Download},

year  = {2013},

date = {2013-09-01},

booktitle = {VMV 2013 - Vision, Modeling, Visualization},

pages = {121--128},

address = {Lugano},

keywords = {},

pubstate = {published},

tppubtype = {inproceedings}

}
2012
Paul Klemm, Steffen Oeltze, Katrin Hegenscheid, Henry Völzke, Klaus-Dietz Tönnies, Bernhard Preim
Visualization and Exploration of Shape Variance for the Analysis of Cohort Study Data Proceedings Article
In: VMV 2012 - Vision, Modeling and Visualization, pp. 221–222, 2012.
@inproceedings{Klemm_2012_VMV,

title = {Visualization and Exploration of Shape Variance for the Analysis of Cohort Study Data},

author = {Paul Klemm and Steffen Oeltze and Katrin Hegenscheid and Henry Völzke and Klaus-Dietz Tönnies and Bernhard Preim},

url = {https://www.vismd.de/wp-content/uploads/legacy/klemm_2012_vmv.pdf, PDF Download},

year  = {2012},

date = {2012-01-01},

booktitle = {VMV 2012 - Vision, Modeling and Visualization},

pages = {221--222},

keywords = {},

pubstate = {published},

tppubtype = {inproceedings}

}