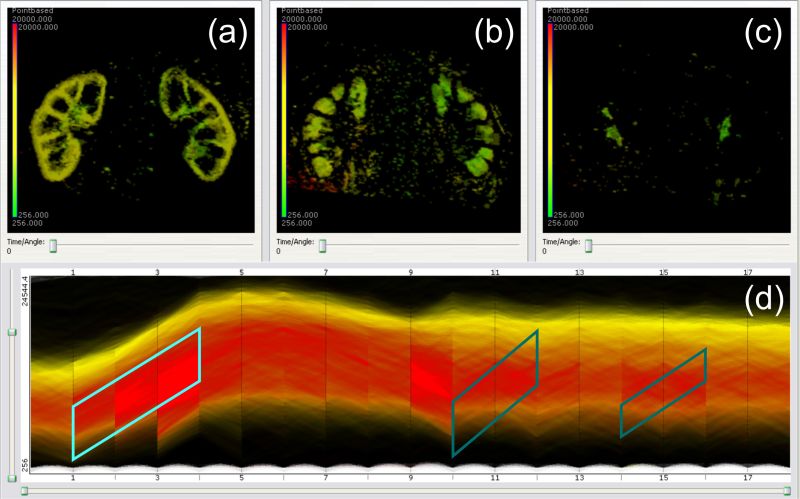
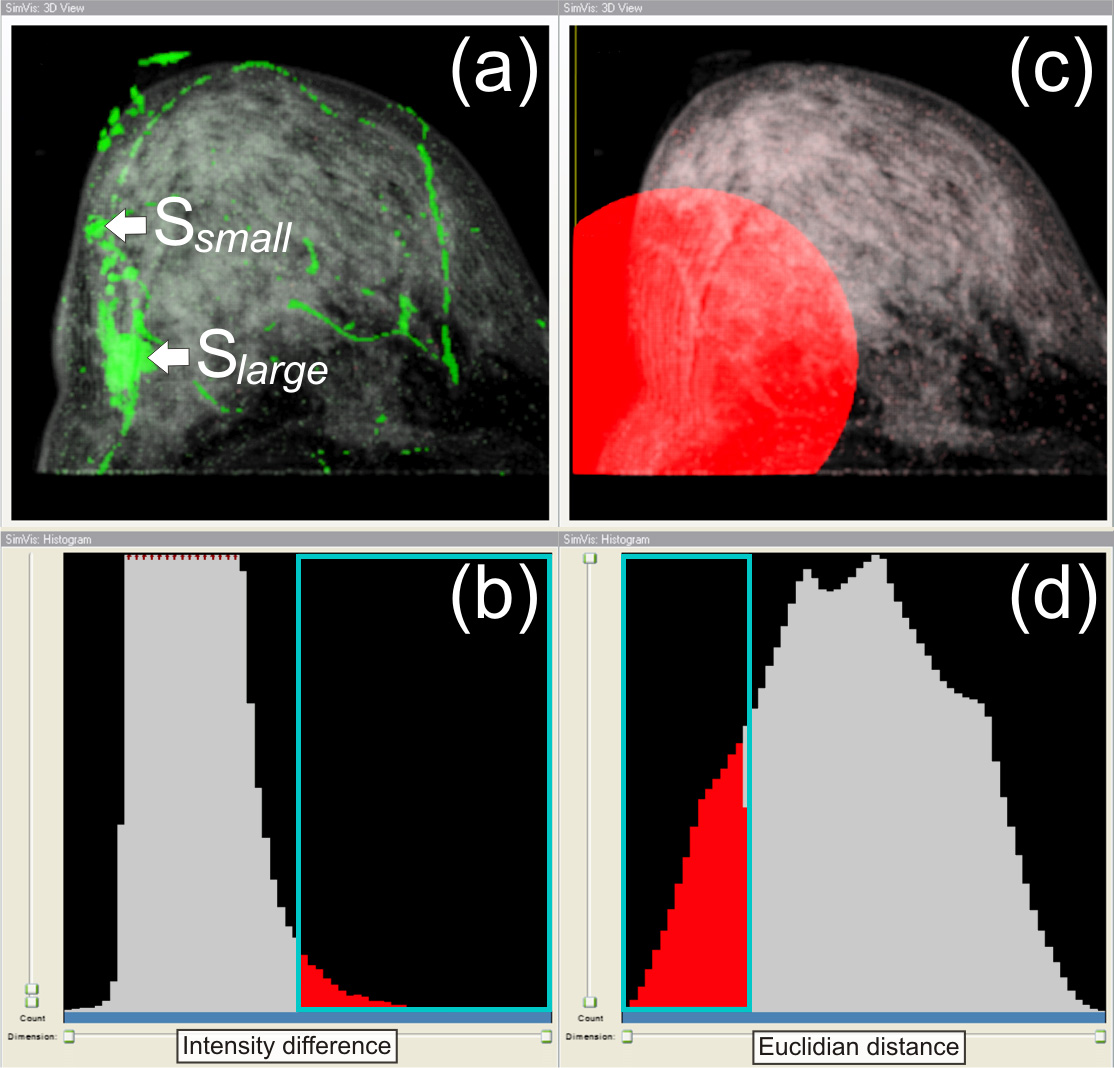
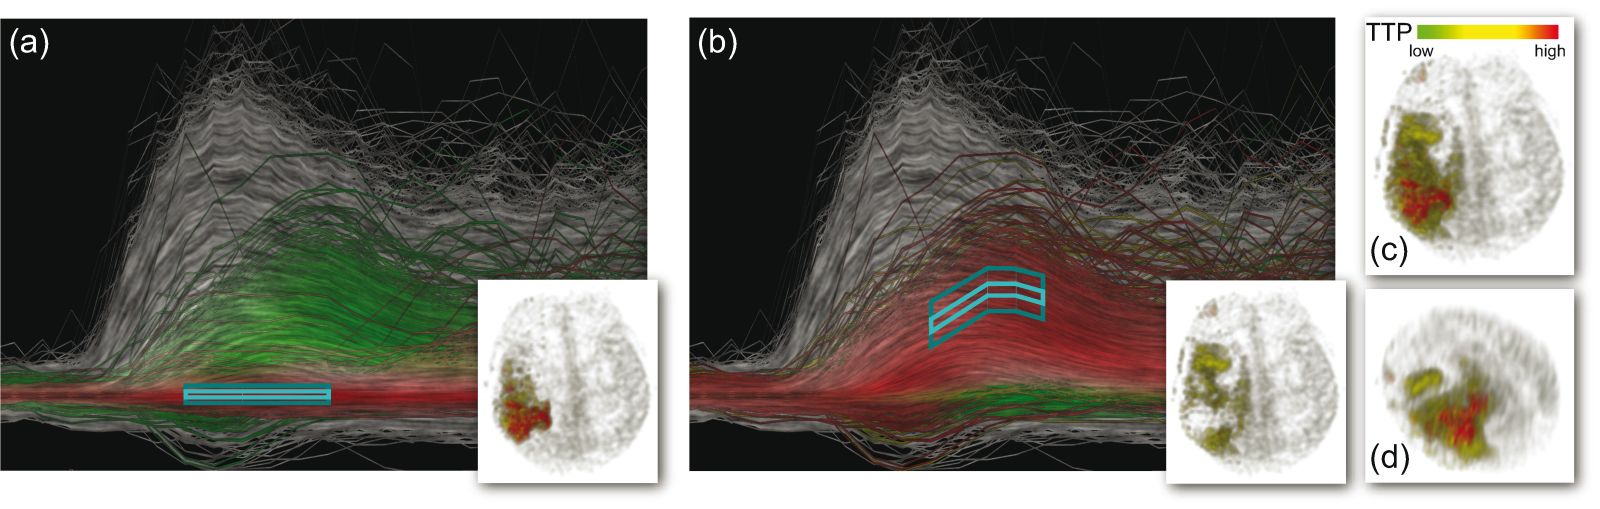
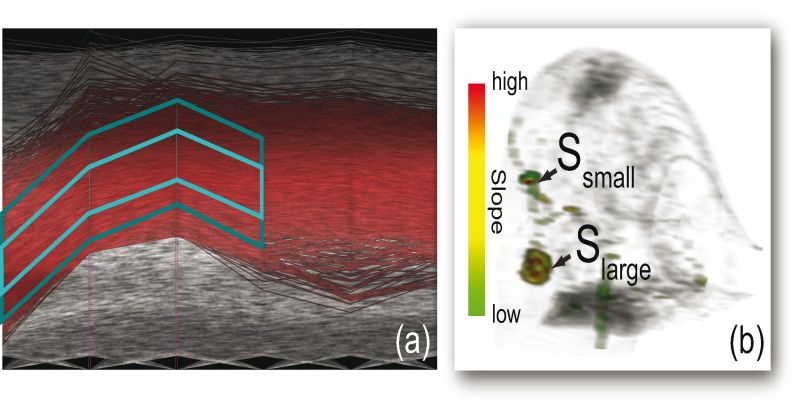
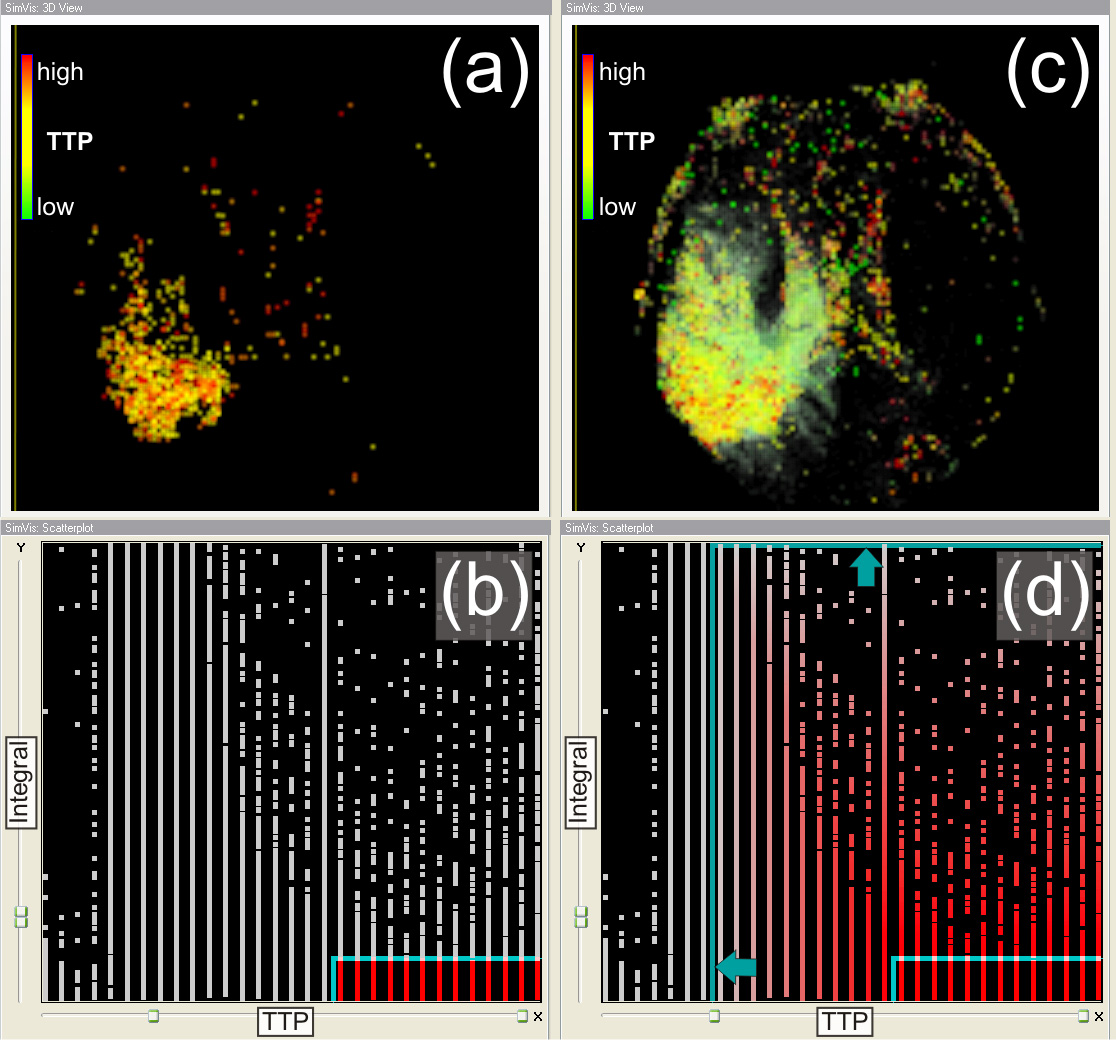
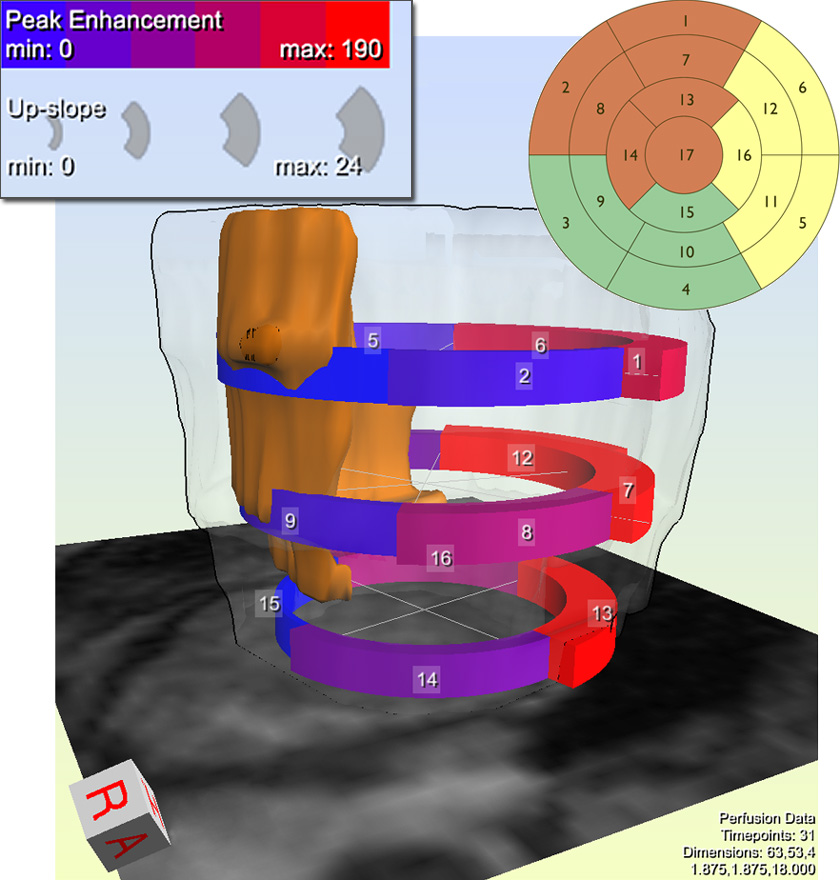
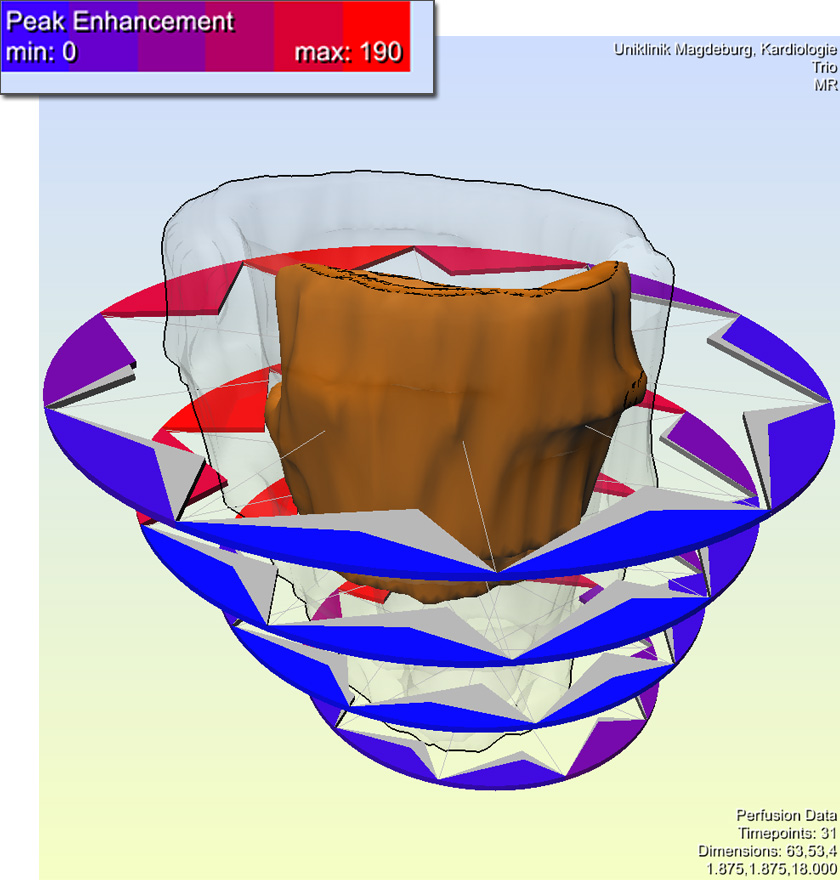
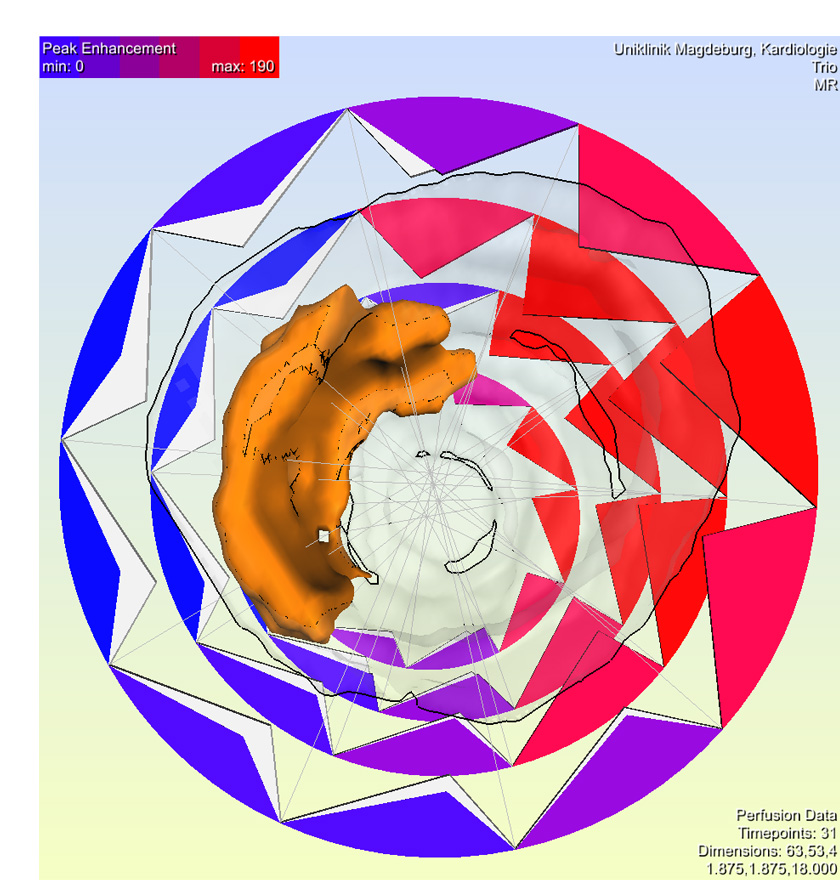
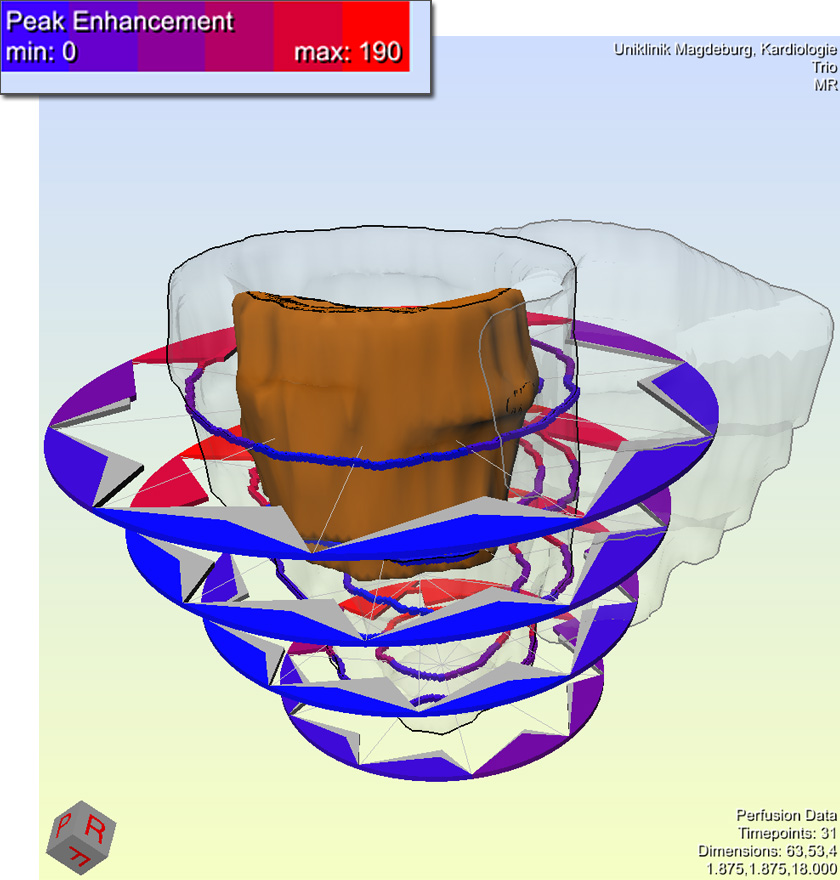
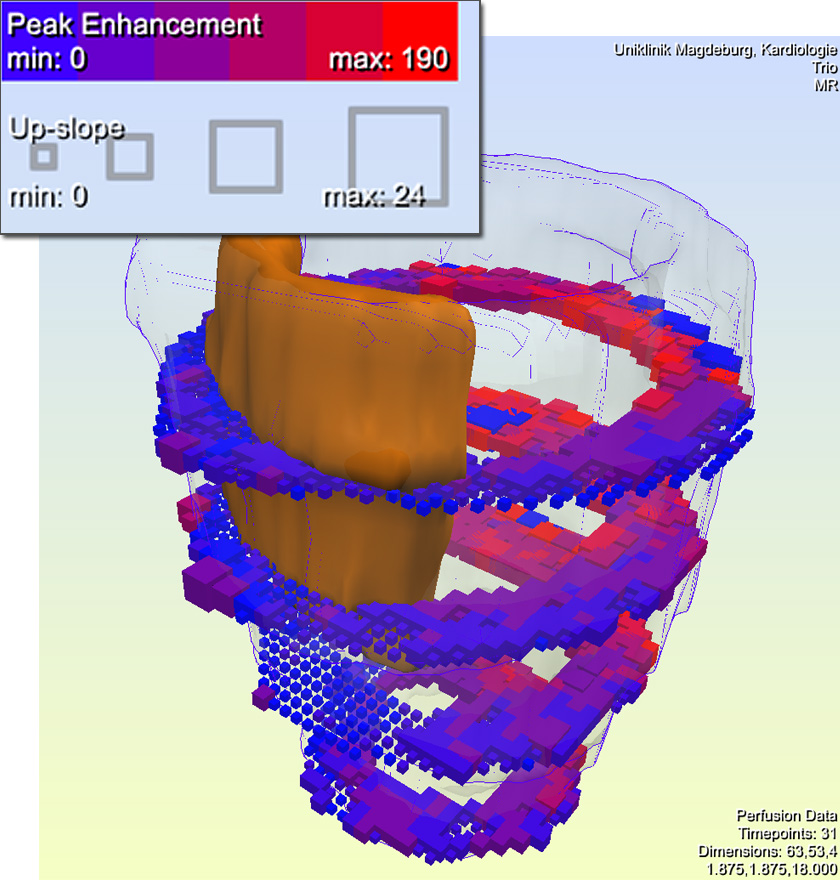
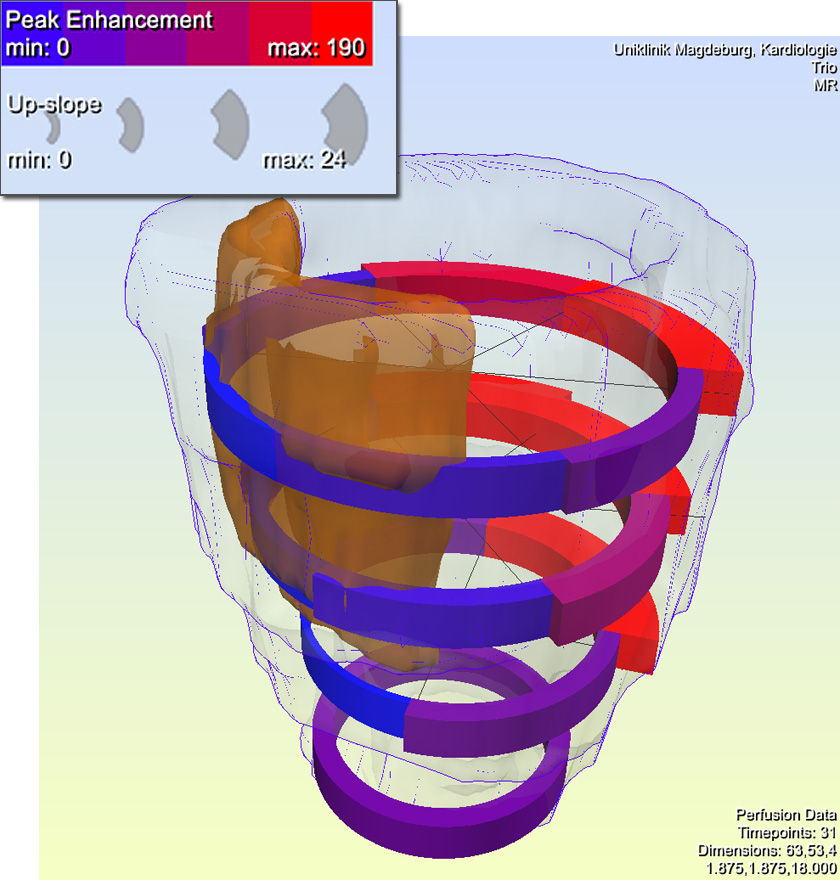
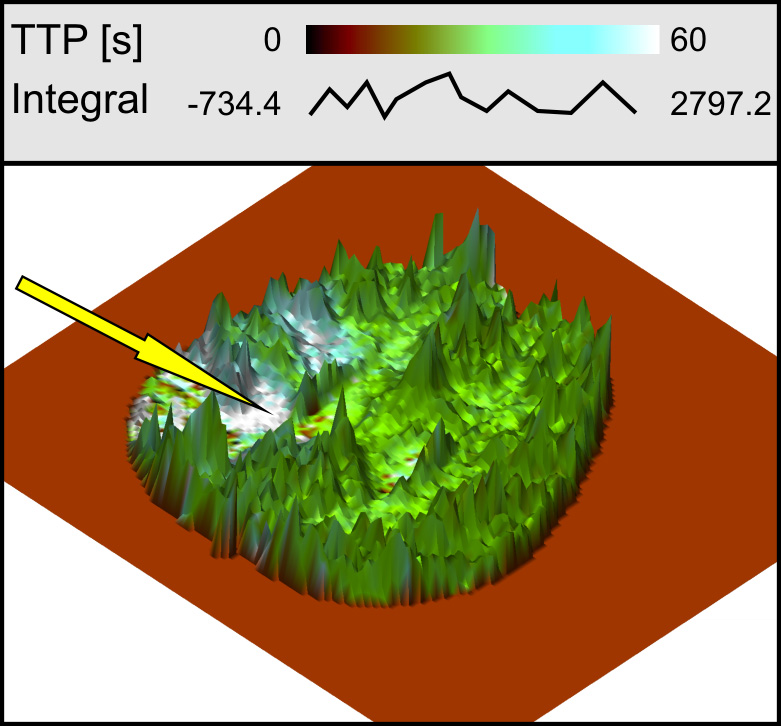
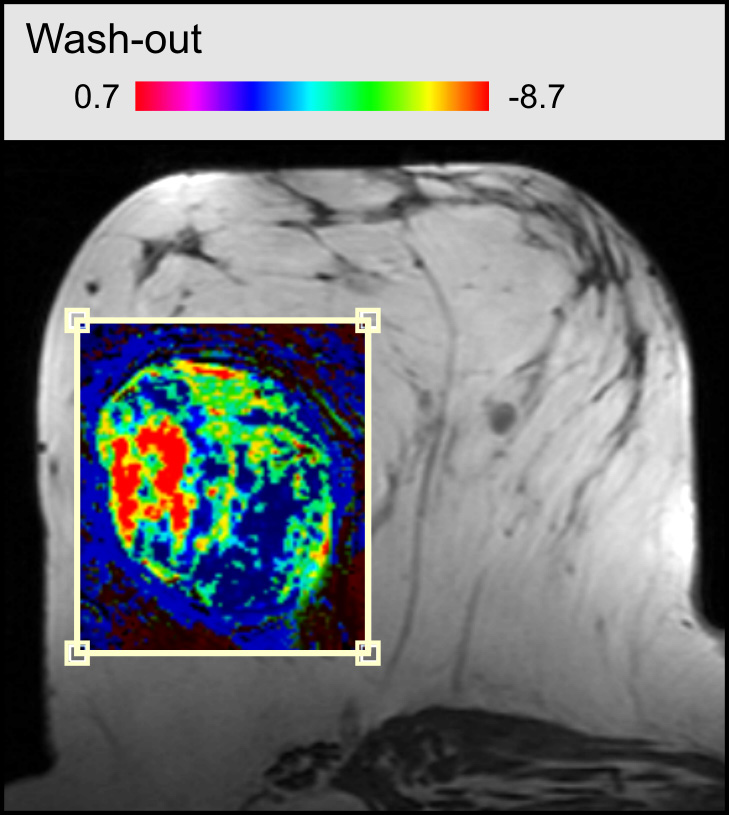
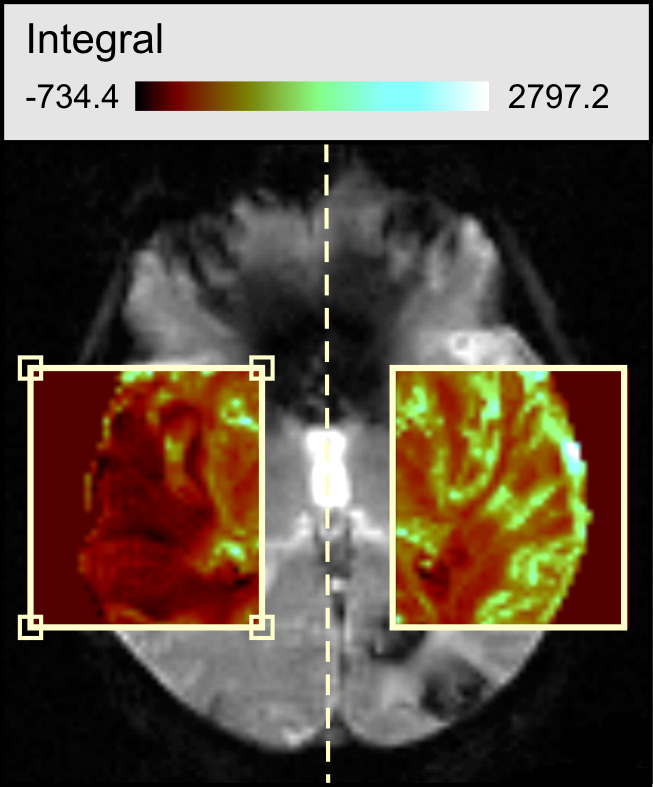
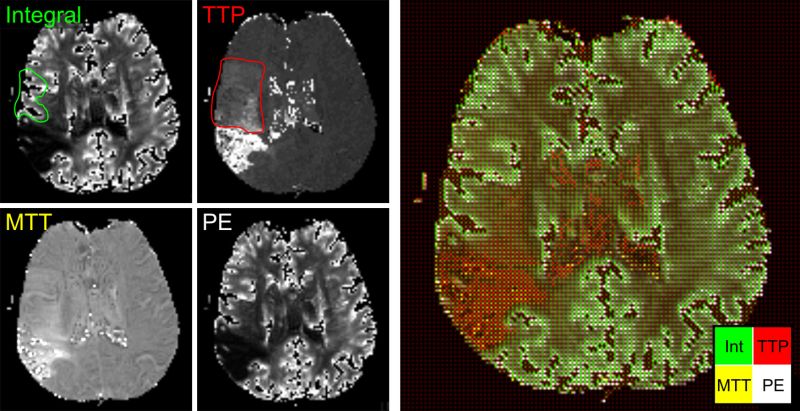
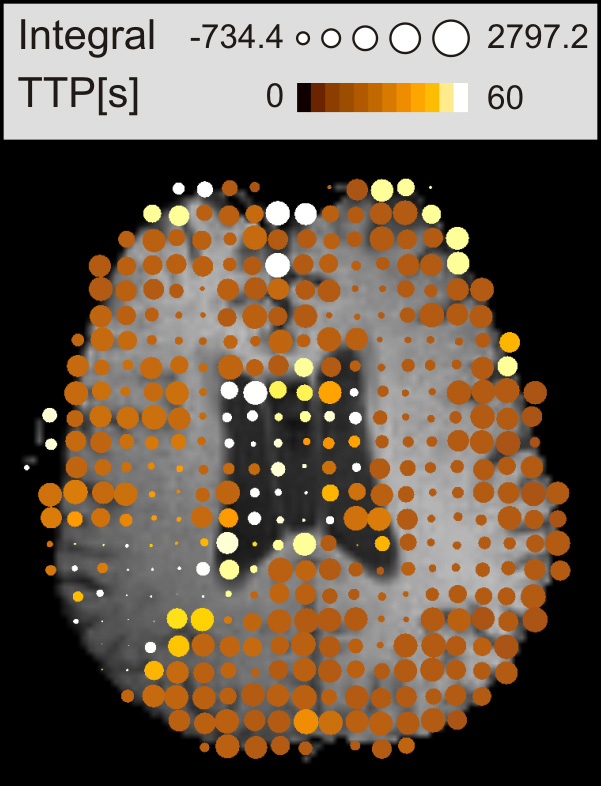
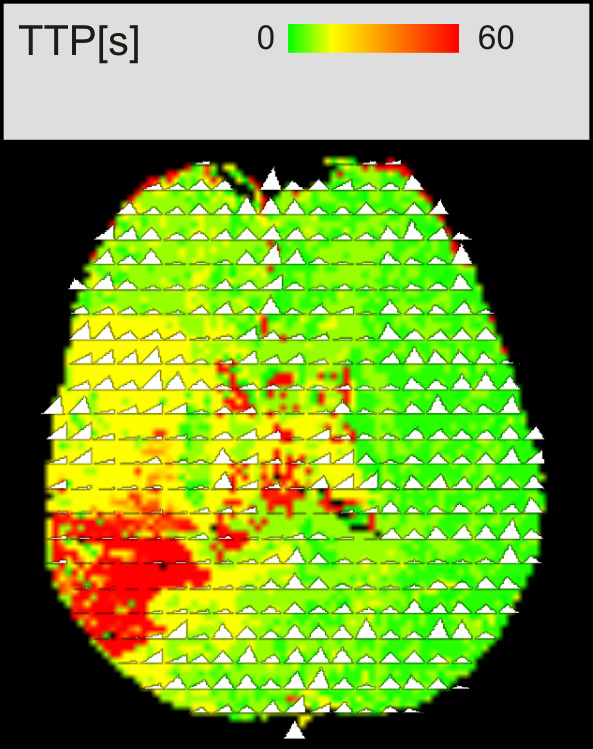
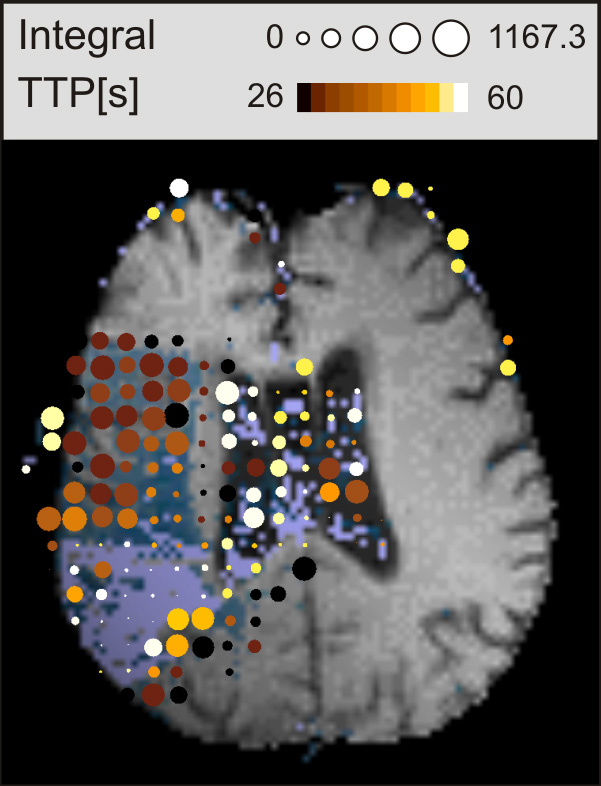
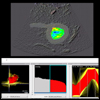
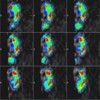
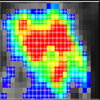
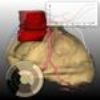
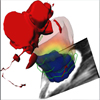
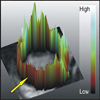
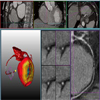
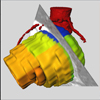
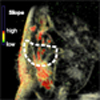
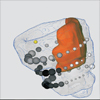
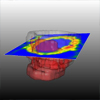
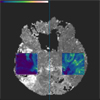
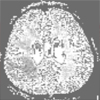
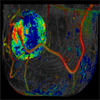
Perfusion data are dynamic medical image data which characterize the regional blood flow in tissue. We focus on the visualization and exploration of perfusion data for diagnostic purposes in three major application areas: ischemic stroke diagnosis, breast tumor diagnosis and the diagnosis of coronary heart disease.
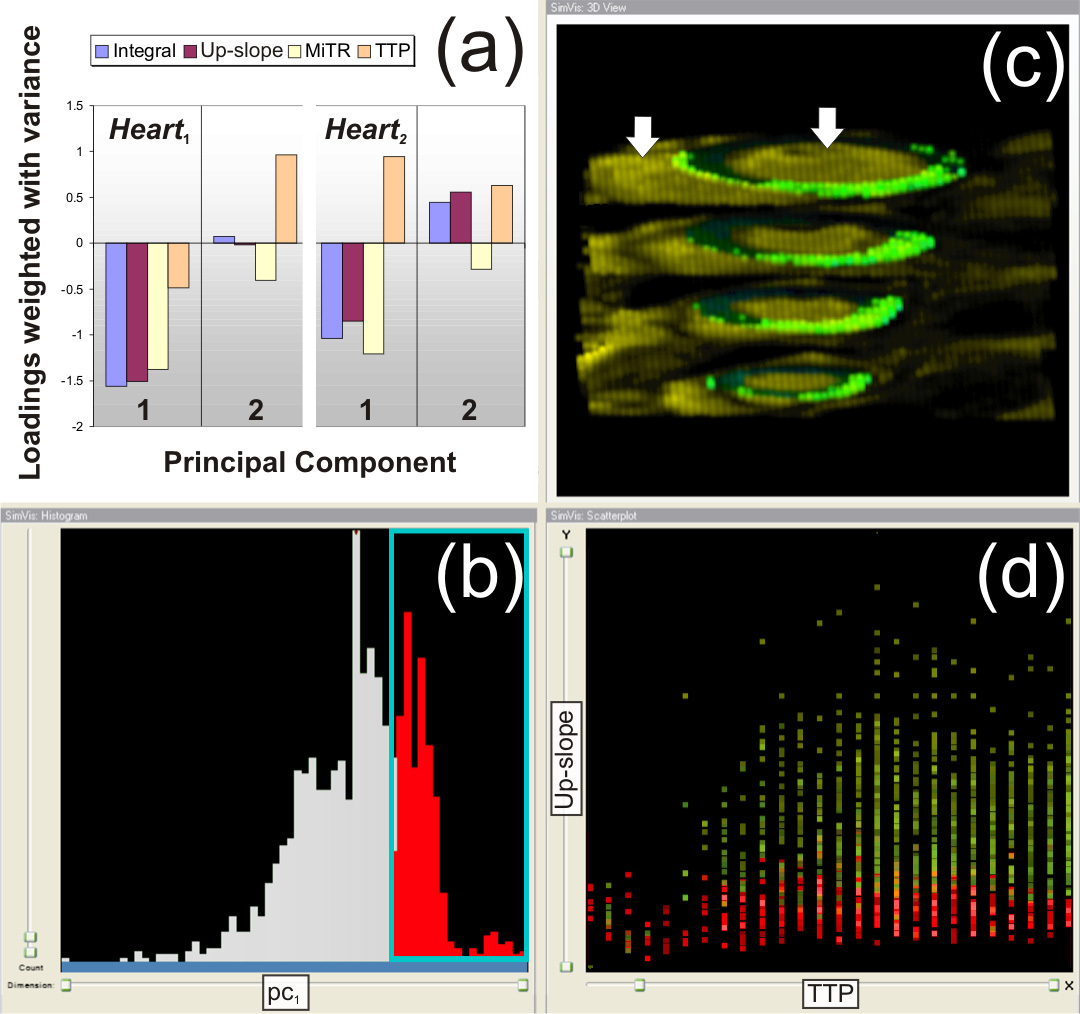
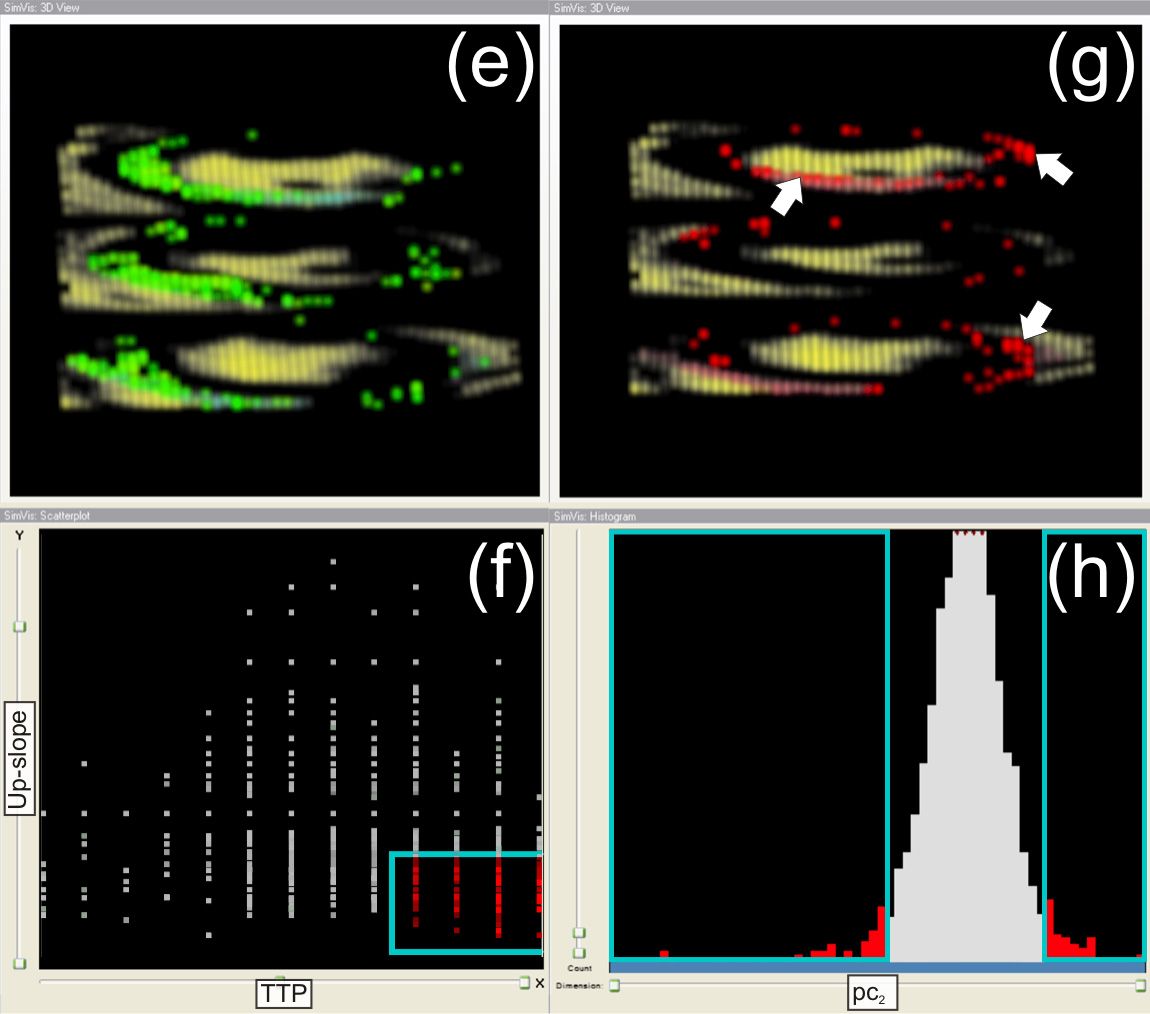
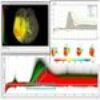
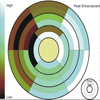
For a reliable diagnosis, the multi-dimensional space of perfusion parameters needs to be explored. Therefore, we aim at different exploration and visualization techniques for an improved diagnosis. Furthermore, visual analytics approaches have been developed and integrated in the diagnosis frameworks.
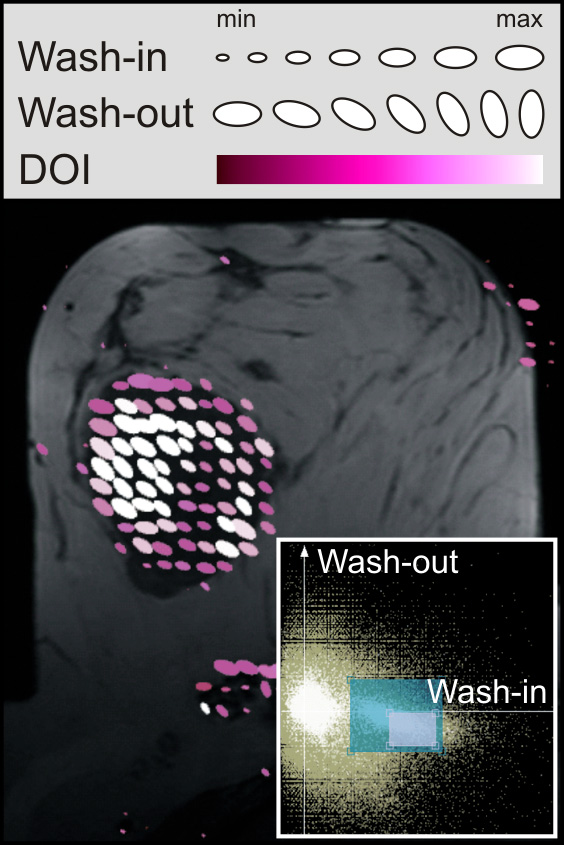
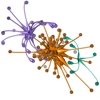
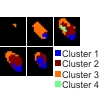
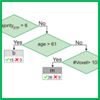
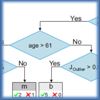
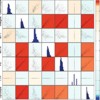
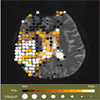
During the evaluation of perfusion data, clustering is often carried out to reduce the influence of noise or image artifacts when analyzing the temporal variation of the tissue’s signal intensity values. Thus, the exploration of perfusion data comprises the adaption of clustering methods as well as the evaluation of these clustering methods based on an automatic classification into benign and malignant tumors.
This project was a subproject of the DFG funded Scalable Visual Analytics priority programme.
Publications
2014
Visualization of 3D Cluster Results for Medical Tomographic Image Data Proceedings Article
In: In Proc. of Conference on Computer Graphics Theory and Applications (VISIGRAPP/GRAPP), pp. 169–176, 2014.
Adapted Spectral Clustering for Evaluation and Classification of DCE-MRI Breast Tumors Proceedings Article
In: Bildverarbeitung für die Medizin (BVM), pp. 198–203, 2014.
2013
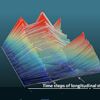
Visual analysis of longitudinal brain tumor perfusion Proceedings Article
In: Proc. of the SPIE Medical Imaging, pp. 86700Z, 2013.
Can we Distinguish Between Benign and Malignant Breast Tumors in DCE-MRI by Studying a Tumors Most Suspect Region Only? Proceedings Article
In: Proc. of Symposium on Computer-Based Medical Systems (CBMS), pp. 59-64, 2013.
Classification of Benign and Malignant DCE-MRI Breast Tumors by Analyzing the Most Suspect Region Proceedings Article
In: Bildverarbeitung für die Medizin (BVM), pp. 45–50, 2013.
Method for the Evaluation of US Perfusion for Brain Tumor Surgery Proceedings Article
In: 12. Jahrestagung der Deutschen Gesellschaft für Computer- und Roboter Assistierte Chirurgie, pp. 198–202, Innsbruck, 2013.
2011

Local similarity measures for lesion registration in DCE-MRI of the breast Journal Article
In: Annals of the BMVA, vol. 3, pp. 1–13, 2011.
The File-Card-Browser View for Breast DCE-MRI Data Proceedings Article
In: Bildverabeitung für die Medizin (BVM), pp. 314–318, Lübeck, 2011.
2010
Visuelle Analyse medizinischer Daten Journal Article
In: Informatik Spektrum, vol. 33(6), pp. 569–579, 2010.
A visual analytics approach to diagnosis of breast DCE-MRI data Journal Article
In: Computer and Graphics, vol. 34(5), pp. 602–611, 2010.
2009
A Visual Analytics Approach to Diagnosis of Breast DCE-MRI Data Proceedings Article
In: Proc. of Vision, Modeling, and Visualization (VMV), pp. 351–362, Braunschweig, 2009.
Visual Analysis of Cerebral Perfusion Data -- Four Interactive Approaches and a Comparison Proceedings Article
In: Proc. of the 6th International Symposium on Image and Signal Processing and Analysis (ISPA), pp. 588–595, 2009.
Survey of the Visual Exploration and Analysis of Perfusion Data Journal Article
In: IEEE Transactions on Visualization and Computer Graphics, vol. 15(2), pp. 205–220, 2009.
2008
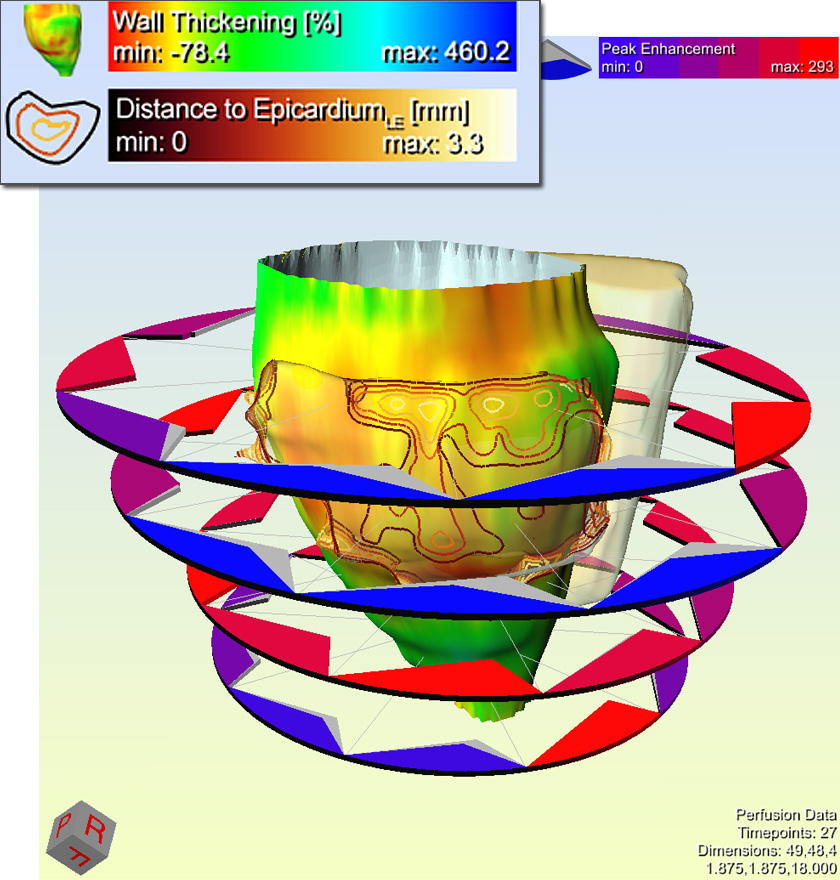
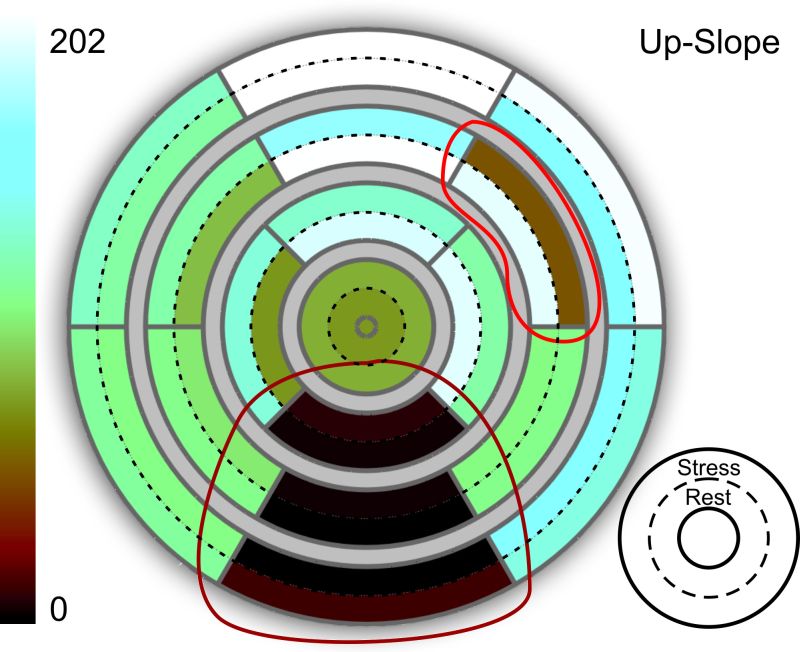
A Comprehensive Approach to the Analysis of Contrast Enhanced Cardiac MR Images Journal Article
In: IEEE Transactions on Medical Imaging, vol. 27(11), no. 11, pp. 1592–1610, 2008.
A Four-level Focus+Context Approach to Interactive Visual -- Analysis of Temporal Features in Large Scientific Data Journal Article
In: Computer Graphics Forum (EuroVis), vol. 27 (3), pp. 775–782, 2008.
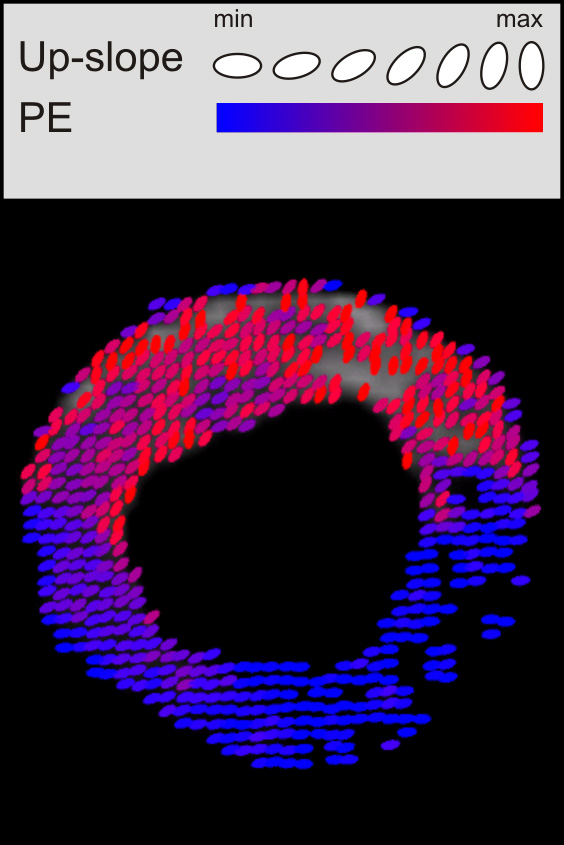
Glyph-Based Visualization of Myocardial Perfusion Data and Enhancement with Contractility and Viability Information Proceedings Article
In: VCBM, pp. 11–20, 2008.
Intuitive Mapping of Perfusion Parameters to Glyph Shape Proceedings Article
In: Tolxdorff, T; Braun, J; Deserno, T M; Handels, H; Horsch, A; Meinzer, H P (Ed.): Bildverarbeitung für die Medizin (BVM), pp. 262–266, 2008.
Survey of the Visual Exploration and Analysis of Perfusion Data Proceedings Article
In: IEEE Transactions on Visualization and Graphics, pp. to appear, 2008.
CT Late Enhancement Segmentation for the Combined Analysis of Coronary Arteries and Myocardial Viability Proceedings Article
In: VCBM, pp. 1–10, 2008.
Enhanced Cardio Vascular Image Analysis by Combined Representation of Results from Dynamic MRI and Anatomic CTA Proceedings Article
In: Proc. of SPIE Conference on Medical Image Computing, 2008.
2007
Interactive Visual Analysis of Perfusion Data Journal Article
In: IEEE Transactions on Visualization and Computer Graphics (TVCG), vol. 13, no. 6, pp. 1392–1399, 2007.
Integrierte Visualisierung kardialer MR-Daten zur Beurteilung von Funktion, Perfusion und Vitalität des Myokards Proceedings Article
In: Bildverarbeitung für die Medizin (BVM), pp. 212–216, Springer, 2007.
Novel Methods for Parameter Based Analysis of Myocardial Tissue in MR-Images Proceedings Article
In: SPIE Conference on Medical Image Computing, 2007.
2006
Integrated Visualization of Morphologic and Perfusion Data for the Analysis of Coronary Artery Disease Proceedings Article
In: IEEE/Eurographics Symposium on Visualization, pp. 131–138, Springer, 2006.

New Software Assistants for Cardiovascular Diagnosis Proceedings Article
In: GI-Workshop - Softwareassistenten - Computerunterstützung für die medizinische Diagnose und Therapieplanung, pp. 491–498, Springer, 2006.
2005
Multiparametervisualisierung zur Exploration dynamischer Bilddaten Proceedings Article
In: Bildverarbeitung für die Medizin (BVM), pp. 317–321, Springer, 2005.
2003
Mehrdimensionale Visualisierung dynamischer Bilddaten am Beispiel der Durchblutungsquantifizierung Proceedings Article
In: Simulation und Visualisierung, pp. 77–88, 2003.
2002
Exploration of time-varying data for Medical Diagnosis Proceedings Article
In: Vision, Modelling und Visualization (VMV), pp. 31–38, Erlangen, 2002.