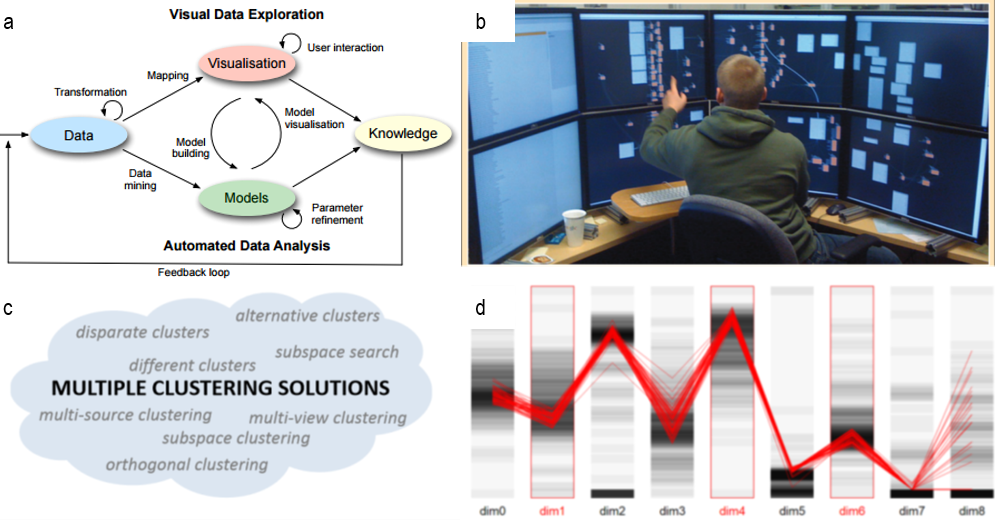
b Patrick Fiaux et al.: Bixplorer: Visual Analytics with Biclusters. Computer 46 (8) pp. 90-94, 2013.
c Emmanuel Müller et al.: Discovering multiple clustering solutions: Grouping objects in different views of the data. IEEE International Conference on Data Engineering (ICDE), 2012.
d Michael Hund et al.: Visual Quality Assessment of Subspace Clustering. KDD Workshop on Interactive Data Exploration and Analytics (IDEA), 2016.
This lecture teaches how to analyze large, high-dimensional, partially unreliable, and incomplete data using data analysis techniques and interactive visualizations that are tightly coupled. It explains the properties and parameters of important data analysis methods and shows how these methods can be integrated into Visual Analytics systems.
The interdisciplinary character of the development and use of Visual Analytics approaches is emphasized. This also includes questions of visual perception and cognitive processing of visual data and their role in decision-making processes. Special attention is given to the knowledge generation process, the process by which observations, hypotheses, statistical results and other artifacts are generated and managed. The application examples range from financial data (stock prices), data of credit card movements, gene expression data to epidemiological data and patient data. Target groups of such applications are investors, security departments, biologists, statisticians and physicians.
You can see an interview with Prof. Preim on the topic of Visual Analytics on Youtube.
Organizational Issues
Audience: WPF CV-Master 1-3; WPF INF-Master 1-3; WPF IngIF-Master 1-3; WPF WIF-Master 1-3; WPF DKE-Master 1-3; WPF DigiEng-Master 1-3; WPF Statistik-Master 1-3; WPF VC-Master 1-3
Graduation: Examination
ECTS-Credits: 6
Examination requirements:
– Timely registration (approx. four weeks in advance!)
– Voting for at least 67% of the exercise tasks
Exam
You can find a list of example questions for the exam in the Visual Analytics Example Exam Questions.
Lecture
In addition to the face-to-face lectures, you can find the lecture video recordings from a previous year below. You may use them as a supplement, they do not introduce information beyond the synchronous lecture.
Location: G29-307
Time: Thursday., 1:00 – 3:00 pm(weekly) (→ see LSF)
1. Lecture (in presence): 09.04.2026
No lecture on May 14 and May 28. Instead of the lecture on May 28, look at the two videos on “Subspace Clustering“
Course of Lectures and Slides
Literature & Links
Exercise
From 29.04 onwards, a new exercise sheet will be posted online here every Monday. In the following week, you will have to vote for the tasks for which you feel able to present your solution in your corresponding exercise session. At the end of the semester, you must have voted for at least 67% of the exercise tasks to be allowed to take the exam.
You have to sign up for an exercise group until the 11.04. via LSF.
Course of Exercises and Slides
| # | Presentations in week | Topic | Slides & Exercise Sheets | Materials |
|---|---|---|---|---|
| 1 | 06.04. | – | – | – |
| 2 | 13.04. | Introduction 1 (no meeting) | Intro VA & Vis | |
| 3 | 20.04. | Introduction 2 (no meeting) | Intro to R & RStudio | Heights_dataset |
| 4 | 27.04 | Introduction 3 (no meeting) | Creating Vis. with ggplot2 | |
| 5 | 04.05. | 1. Exercise sheet | ||
| 6 | 11.05. | 2. Exercise sheet | ||
| 7 | 18.05. | 3. Exercise sheet | ||
| 8 | 25.05. | No Exercise due to Whitsun | ||
| 9 | 01.06. | 4. Exercise sheet | ||
| 10 | 08.06. | 5. Exercise sheet | ||
| 11 | 15.06. | 6. Exercise sheet | ||
| 12 | 22.06 | 7. Exercise sheet | ||
| 13 | 29.06. | 8. Exercise sheet | ||
| 14 | 06.07. | 9. Exercise sheet | ||
| Deadline: 15.07 | Additional task: only for students who did not obtain 31 votation points. The additional task consists of 6 tasks each worth 1 point. Therefore, if you have between 25 and 30 votation points you can still obtain the admission to the exam when you submit the additional task on time. |