This user has not added any information to their profile yet.
Latest Publications
Benedikt Mayer
From Exploratory to Explanatory Interactive Visualization of Spatio-Temporal Conflict Data PhD Thesis
2024.
@phdthesis{Mayer2024,
title = {From Exploratory to Explanatory Interactive Visualization of Spatio-Temporal Conflict Data},
author = {Benedikt Mayer},
year = {2024},
date = {2024-09-24},
abstract = {Violent conflicts cause human suffering and devastation worldwide. Conflict research studies the causes, dynamics, and impact of such conflicts, as well as ways to prevent them. Interactive data visualization can support conflict researchers in exploring corresponding data. However, so far, barely any studies have been conducted analyzing how to provide this kind of exploratory support in the field of conflict research.
In contrast, interactive data visualization is already commonly used in online stories reporting on conflicts, as it can help to explain space- and time-dependent developments more clearly. However, there is little structured research of how such datadriven visual storytelling can be performed for stories with a spatio-temporal context, like those about conflicts.
Exploratory and explanatory approaches can also be combined, allowing users to get a deeper understanding of the conveyed information. While this approach is more commonly used to target broad audiences in the context of science communication, it can also be used to communicate scientific information to researchers. However, little research has been performed in this direction as well.
To address the listed issues, we collaborated with a conflict researcher to conduct three main studies. They are positioned along a spectrum between exploration and explanation to answer the question: “How can interactive visualization be used to support the exploration and explanation of spatio-temporal conflict data?”
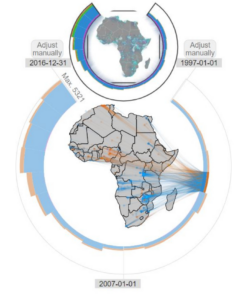
In the first study, we investigated how to design an application that allows conflict researchers to explore the results of a process in which multiple conflict data sets are integrated into one holistic set. We abstracted the underlying domain problems and derived a workflow and application design to solve the identified problems. An evaluation involving five conflict researchers showed that the application helped them to better understand and validate the results of the data integration. However, it also showed that even experts require a considerable amount of explanation to properly use such exploratory applications.
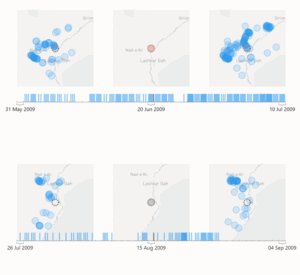
In the second study, we investigated how to combine exploration and explanation to communicate the workings of a scientific method to conflict researchers, based on a visual data story. We
distilled the story creation process and evaluated the story with eight conflict researchers. It showed that they accepted the storytelling approach well, and their feedback allowed us to derive a set of guidelines for performing such exploratory explanation for experts.
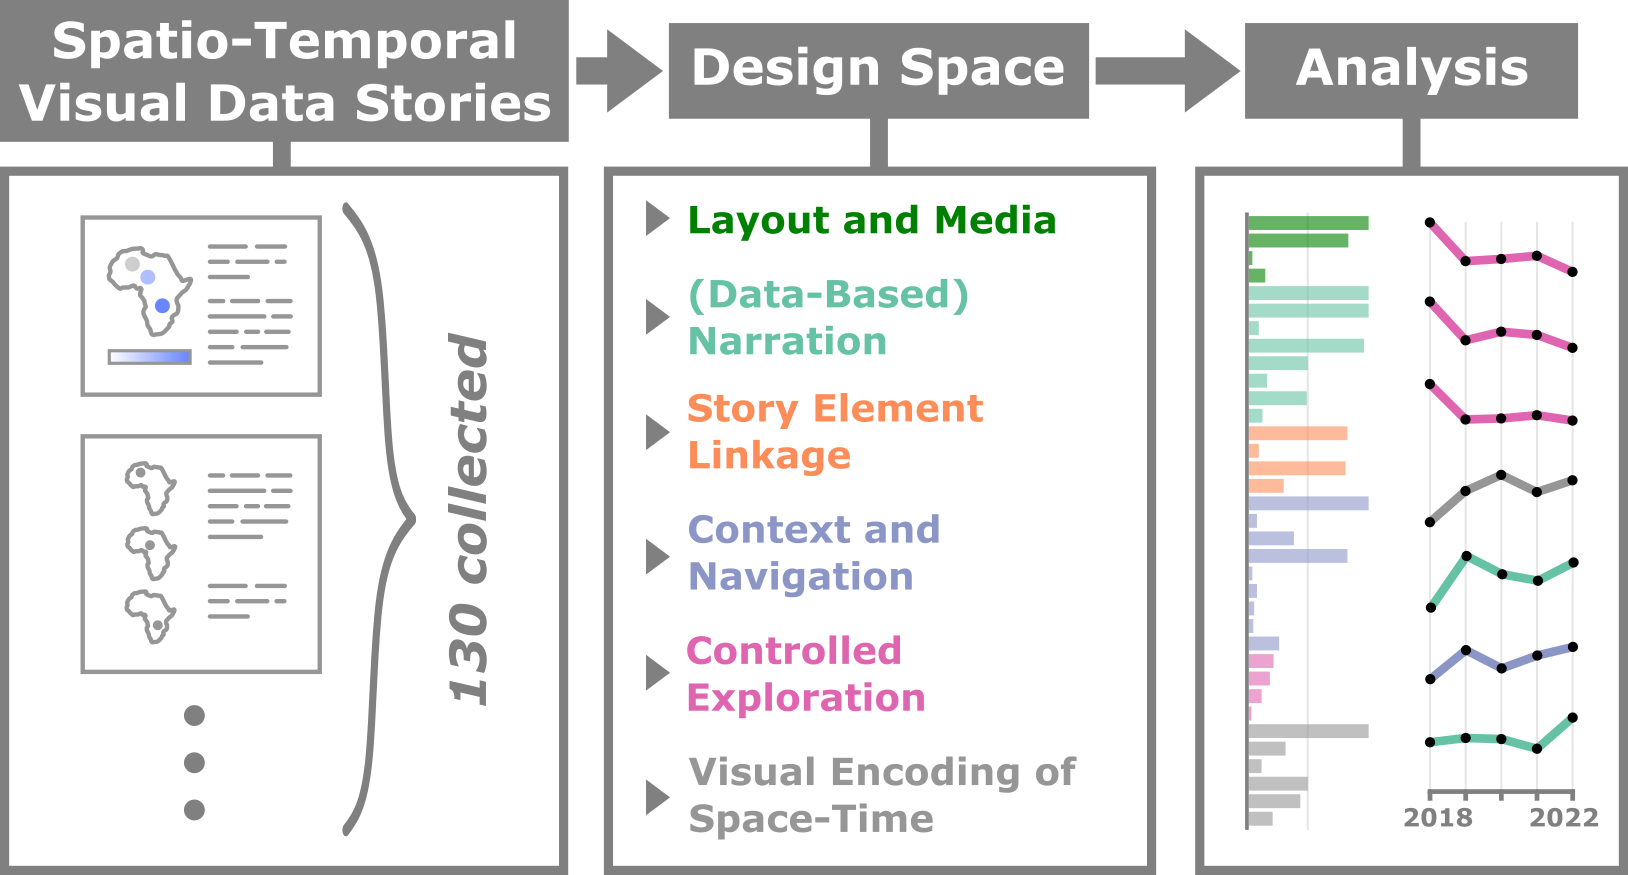
In the third study, we collected 130 data stories with a spatio-temporal context to investigate how visual storytelling was applied in them for explaining the underlying messages. To do so, we merged and adapted three existing design spaces and used them to classify the stories based on which storytelling techniques they employed. We analyzed the resulting data, identifying various ways to combine the storytelling techniques as well as trends that occurred over the years, e.g., towards more easily consumable stories, and towards updating and extending stories over time.
Overall, our studies showed several promising directions for how interactive visualization can support the exploration and explanation of spatio-temporal conflict data. However, it also became clear that more research is necessary. Accordingly, it should be investigated how to make exploratory applications more accessible through explanation, how to make the process of creating spatio-temporal data stories more efficient, and what the role of interaction in explanatory applications can be.},
keywords = {},
pubstate = {published},
tppubtype = {phdthesis}
}
In contrast, interactive data visualization is already commonly used in online stories reporting on conflicts, as it can help to explain space- and time-dependent developments more clearly. However, there is little structured research of how such datadriven visual storytelling can be performed for stories with a spatio-temporal context, like those about conflicts.
Exploratory and explanatory approaches can also be combined, allowing users to get a deeper understanding of the conveyed information. While this approach is more commonly used to target broad audiences in the context of science communication, it can also be used to communicate scientific information to researchers. However, little research has been performed in this direction as well.
To address the listed issues, we collaborated with a conflict researcher to conduct three main studies. They are positioned along a spectrum between exploration and explanation to answer the question: “How can interactive visualization be used to support the exploration and explanation of spatio-temporal conflict data?”
In the first study, we investigated how to design an application that allows conflict researchers to explore the results of a process in which multiple conflict data sets are integrated into one holistic set. We abstracted the underlying domain problems and derived a workflow and application design to solve the identified problems. An evaluation involving five conflict researchers showed that the application helped them to better understand and validate the results of the data integration. However, it also showed that even experts require a considerable amount of explanation to properly use such exploratory applications.
In the second study, we investigated how to combine exploration and explanation to communicate the workings of a scientific method to conflict researchers, based on a visual data story. We
distilled the story creation process and evaluated the story with eight conflict researchers. It showed that they accepted the storytelling approach well, and their feedback allowed us to derive a set of guidelines for performing such exploratory explanation for experts.
In the third study, we collected 130 data stories with a spatio-temporal context to investigate how visual storytelling was applied in them for explaining the underlying messages. To do so, we merged and adapted three existing design spaces and used them to classify the stories based on which storytelling techniques they employed. We analyzed the resulting data, identifying various ways to combine the storytelling techniques as well as trends that occurred over the years, e.g., towards more easily consumable stories, and towards updating and extending stories over time.
Overall, our studies showed several promising directions for how interactive visualization can support the exploration and explanation of spatio-temporal conflict data. However, it also became clear that more research is necessary. Accordingly, it should be investigated how to make exploratory applications more accessible through explanation, how to make the process of creating spatio-temporal data stories more efficient, and what the role of interaction in explanatory applications can be.
Benedikt Mayer, Karsten Donnay, Kai Lawonn, Bernhard Preim, Monique Meuschke
Expert exploranation for communicating scientific methods - A case study in conflict research Journal Article
In: Computers & Graphics, vol. 120, pp. 103937, 2024.
BibTeX | Links:
@article{Mayer2024b,

title = {Expert exploranation for communicating scientific methods - A case study in conflict research},

author = {Benedikt Mayer and Karsten Donnay and Kai Lawonn and Bernhard Preim and Monique Meuschke},

url = {https://www.sciencedirect.com/science/article/pii/S0097849324000724?via%3Dihub},

doi = {https://doi.org/10.1016/j.cag.2024.103937},

year  = {2024},

date = {2024-01-01},

urldate = {2024-01-01},

journal = {Computers & Graphics},

volume = {120},

pages = {103937},

publisher = {Elsevier},

keywords = {},

pubstate = {published},

tppubtype = {article}

}
Georgii Kostiuchik, Lalith Sharan, Benedikt Mayer, Ivo Wolf, Bernhard Preim, Sandy Engelhardt
Surgical Phase and Instrument Recognition: How to identify appropriate Dataset Splits Journal Article
In: International Journal of Computer Assisted Radiology and Surgery, pp. 21, 2023.
BibTeX | Links:
@article{Kostiuchik_JCARS_2023,

title = {Surgical Phase and Instrument Recognition: How to identify appropriate Dataset Splits},

author = {Georgii Kostiuchik and Lalith Sharan and Benedikt Mayer and Ivo Wolf and Bernhard Preim and Sandy Engelhardt},

doi = {https://doi.org/10.48550/arXiv.2306.16879},

year  = {2023},

date = {2023-10-31},

journal = {International Journal of Computer Assisted Radiology and Surgery},

pages = {21},

keywords = {},

pubstate = {published},

tppubtype = {article}

}
Benedikt Mayer, Nastasja Steinhauer, Bernhard Preim, Monique Meuschke
A Characterization of Interactive Visual Data Stories With a Spatio-Temporal Context Journal Article
In: Computer Graphics Forum, vol. n/a, no. n/a, pp. e14922, 2023.
BibTeX | Links:
@article{https://doi.org/10.1111/cgf.14922,

title = {A Characterization of Interactive Visual Data Stories With a Spatio-Temporal Context},

author = {Benedikt Mayer and Nastasja Steinhauer and Bernhard Preim and Monique Meuschke},

url = {https://onlinelibrary.wiley.com/doi/abs/10.1111/cgf.14922},

doi = {https://doi.org/10.1111/cgf.14922},

year  = {2023},

date = {2023-08-18},

journal = {Computer Graphics Forum},

volume = {n/a},

number = {n/a},

pages = {e14922},

keywords = {},

pubstate = {published},

tppubtype = {article}

}
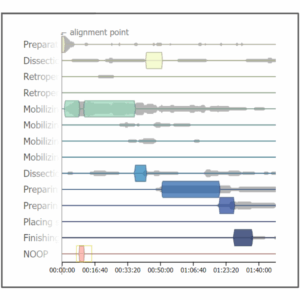
Benedikt Mayer, Monique Meuschke, Jian Chen, Beat Müller-Stich, Martin Wagner, Bernhard Preim, Sandy Engelhardt
Interactive Visual Exploration of Surgical Process Data Journal Article
In: International Journal of Computer-Assisted Radiology and Surgery, vol. 18, no. 1, pp. 127-137, 2023.
BibTeX | Links:
@article{Mayer_2023_IJCARS,

title = {Interactive Visual Exploration of Surgical Process Data},

author = {Benedikt Mayer and Monique Meuschke and Jian Chen and Beat Müller-Stich and Martin Wagner and Bernhard Preim and Sandy Engelhardt},

url = {https://link.springer.com/article/10.1007/s11548-022-02758-1},

year  = {2023},

date = {2023-01-17},

journal = {International Journal of Computer-Assisted Radiology and Surgery},

volume = {18},

number = {1},

pages = {127-137},

keywords = {},

pubstate = {published},

tppubtype = {article}

}
Benedikt Mayer, Kai Lawonn, Karsten Donnay, Bernhard Preim, Monique Meuschke
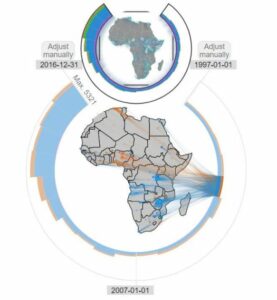
VEHICLE: Validation and Exploration of the Hierarchical Integration of Conflict Event Data Journal Article
In: Computer Graphics Forum, vol. 40, no. 3, 2021.
BibTeX | Links:
@article{mayer_2021_eurovis,

title = {VEHICLE: Validation and Exploration of the Hierarchical Integration of Conflict Event Data},

author = {Benedikt Mayer and Kai Lawonn and Karsten Donnay and Bernhard Preim and Monique Meuschke},

url = {https://diglib.eg.org/bitstream/handle/10.1111/cgf14284/v40i3pp001-012.pdf, PDF Download},

year  = {2021},

date = {2021-01-01},

journal = {Computer Graphics Forum},

volume = {40},

number = {3},

keywords = {},

pubstate = {published},

tppubtype = {article}

}
Benedikt Mayer
Visual Analytics of Participant Evolution in Longitudinal Cohort Study Data Miscellaneous
2018, (Individualprojekt).
BibTeX | Links:
@misc{Mayer_IP_2018,

title = {Visual Analytics of Participant Evolution in Longitudinal Cohort Study Data},

author = {Benedikt Mayer},

url = {https://www.vismd.de/wp-content/uploads/legacy/mayer_ip_2018.pdf, PDF Download},

year  = {2018},

date = {2018-01-01},

note = {Individualprojekt},

keywords = {},

pubstate = {published},

tppubtype = {misc}

}