We are happy to announce that Janine Zöllner and Jorik Jakober have joined the VIS group to pursue their PHD’s in the area of application-based Virtual Reality research. Janine will be working on radiochemistry applications and Jorik in the medical domain.
We say goodbye to our colleagues Sylvia Saalfeld and Sebastian Wagner. Sylvia went to the Technical University of Ilmenau to lead the group for Computational Medicine. Sebastian went to work in the industry. We thank Sylvia and Sebastian for the scientific work they contributed to our group and for the great time we had together with them as our colleagues. We wish them all the best for their future!
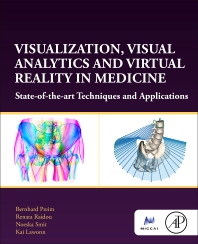
The book “Visualization, Visual Analytics and Virtual Reality in Medicine” (authored by Bernhard Preim, Renata Raidou, Noeska Smit and Kai Lawon) is ready and scheduled to appear on June 1. Here is a link to the book:
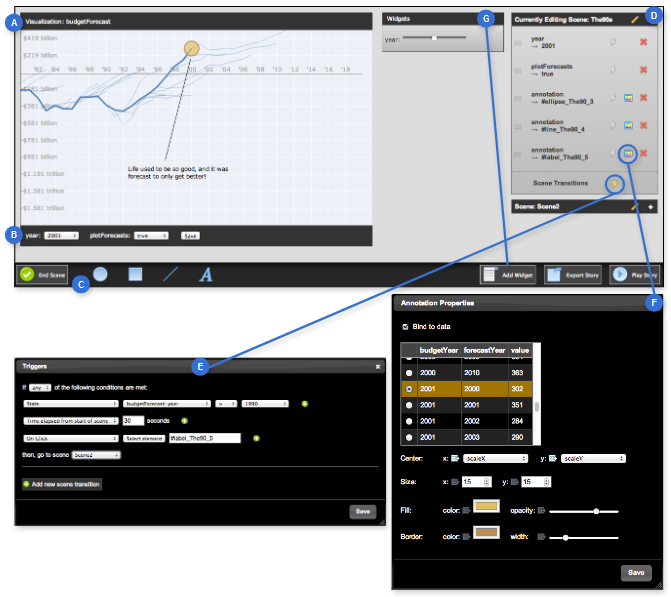
The Covid 19 pandemic has once again shown how important it is to communicate medical knowledge and research insights to a broad audience without medical expertise in an understandable way. Recently, narrative visualization, i.e. the combination of storytelling techniques with interactive graphics is used to communicate scientific findings to a broad audience. Many tools have been developed to generate narrative visualizations based on tabular data. However, it is unclear to what extent these tools are also suitable for medical data, which also include 3D surface and volume data, as well as 2D slice images.
Figure 1: Authoring tool Ellipsis to generate stories based on tabular data [1].
Goal: The goal should be to do an extensive literature review. It shall be analyzed which software solutions are available for the creation of data-driven narrative visualizations and on which input data they are based. In addition, it will be analyzed to what extent existing tools are suitable for dealing with medical data and which requirements a medical-oriented tool for the creation of narrative visualizations should fulfill. Optionally, user interfaces can be prototyped and evaluated for such a medical authoring tool.
Type: Bachelor/Master Thesis (Team project (2 FIN students) would also be possible)
Requirements: Good skills in scientific reading and summarizing scientific papers; critical thinking; good transfer skills regarding the derivation of requirements for a medical narrative tool as well as analysis skills whether this is possible with existing tools.
References [1] Satyanarayan, A., and Heer, J. “Authoring narrative visualizations with ellipsis.” Computer Graphics Forum. Vol. 33. No. 3. 2014.: https://onlinelibrary.wiley.com/doi/full/10.1111/cgf.12392 [2] Conlen, M., and Heer, J. “Idyll: A markup language for authoring and publishing interactive articles on the web.” Proceedings of the 31st Annual ACM Symposium on User Interface Software and Technology. 2018.: https://dl.acm.org/doi/abs/10.1145/3242587.3242600 [3] Meuschke, M., et al. “Towards Narrative Medical Visualization.” arXiv preprint arXiv:2108.05462 (2021).: https://arxiv.org/abs/2108.05462
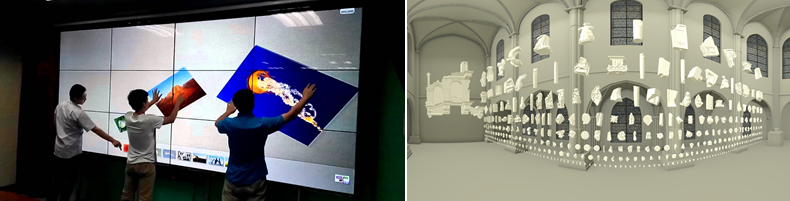
The project’s goal is to create a software/hardware solution that allows the university to present different projects to a broader audience. Examples for projects are:
results of a digital restoration of a monument of Magdeburg’s cathedral
overview of courses of study that the university offers
Tasks
To achieve this, the student has to:
research existing software tools to create interactive presentations for multi-touch displays
research hardware solutions for modular, flexible multi-touch displays
Based on the results of this research, the student should realize an example presentation with the software tools and the hardware.
This project can be realized as a research assistant (HiWi), bachelor thesis/master thesis or student project.
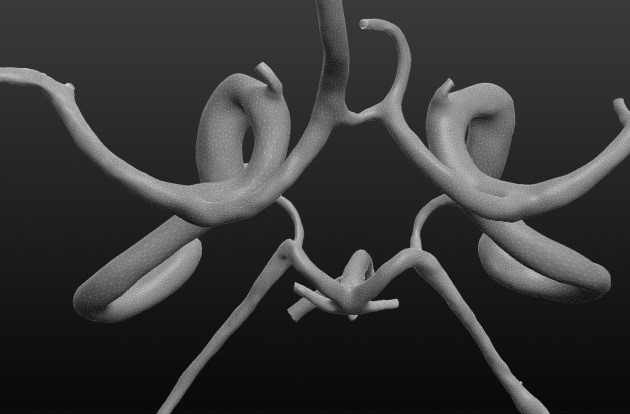
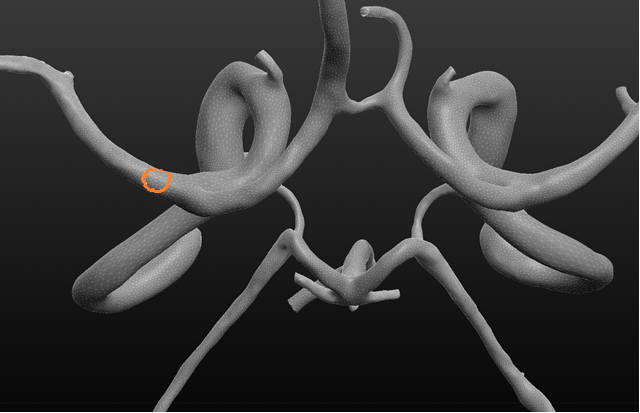
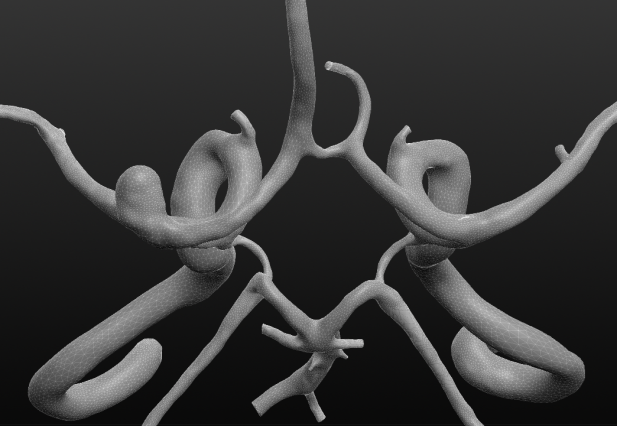
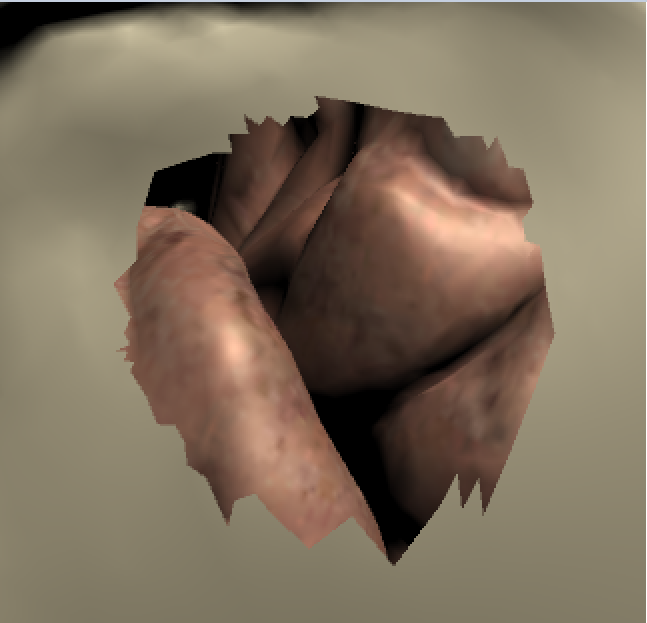
Virtual simulations are a common possibility to provide neurosurgeons with additional training for cerebral aneurysm clipping. To provide appropriate training, the data/models (in this case aneurysms) have to be realistic and different cases should be included. This can be done by using patient-specific data. The problem is that the data is not always available and there are rare cases, so the user cannot train with many different models. Therefore, we are searching for a student who will implement an application to build own aneurysms that can be included in an existing clipping simulation.
Your task would be to:
research existing and similar approaches and acquire some knowledge about cerebral aneurysms
implement an interactive application where the user virtually builds aneurysms
The project should be realized in the game engine Unity, thus the following is required:
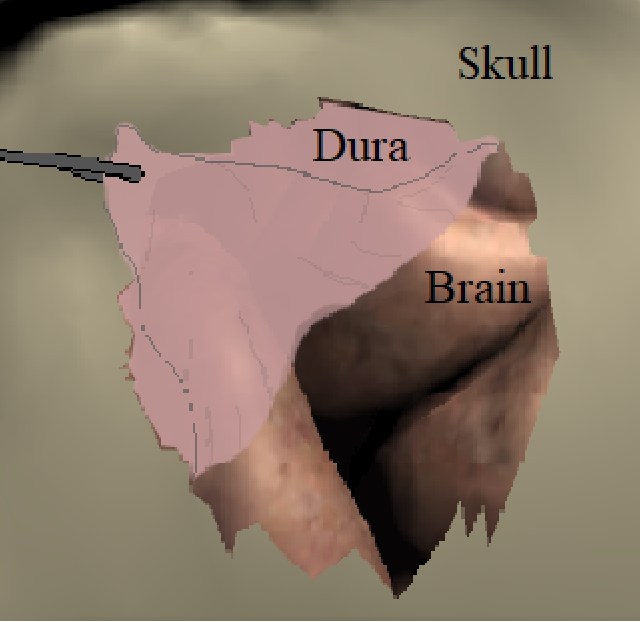
Virtual simulations are a common possibility to provide neurosurgeons with additional training for cerebral aneurysm clipping. Before opening the brain, the dura mater (cerebral membrane) has to be removed carefully. This process is often missing in clipping simulations.
Your task would be to:
research existing and similar approaches
implement an interactive virtual reality application where the user removes the dura mater
The project should be realised in the game engine Unity, thus the following is required:
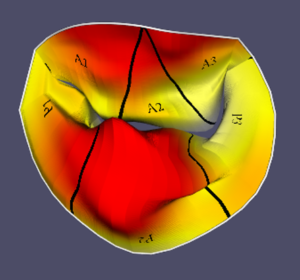
In einem laufenden Forschungsprojekt zusammen mit der Herzchirurgie des Universitätsklinikums Heidelberg untersuchen wir CNN Deep Learning-Verfahren für die 4D-Segmentierung von Herzklappen auf klinischen Datensätzen. Basierend auf einer annotierten Trainingsdatenbank sollen verschiedene Netzwerke entwickelt und miteinander verglichen werden. Die Aufgabe eignet sich als Teamprojekt, kann aber auch für eine Abschlussarbeit angepasst werden.
Anforderungen: Gute bis sehr gute Kenntnisse in Python und C++, Tensorflow/Keras/Pytorch
Im Rahmen aktueller Forschungsprojekte werden Strömungsverhältnisse und die Wanddicke bei Aneurysmen untersucht. Bisherige Bildgebungs-methoden können die Wanddicke nur unzureichend abbilden. Mit intravaskulärem Ultraschall kann auch die äußere Gefäßwand erfasst werden. Im Rahmen des STIMULATE Projekts wird die Eignung von intravaskulärem Ultraschall zur Beurteilung von zerebralen Aneurysmen untersucht. Das Projekt umfasst die neuartige und spannende Analyse von Gefäßinnen- und außenwand (basierend auf Tierpräparaten), die Evaluation von Stentplatzierungen und Auswertung von Strömungssimulationen. Für die Segmentierung von Gefäßinnen- und außenwand steht bereits eine Softwarebibliothek zur Verfügung, die an die neuen, speziellen Datensätze angepasst werden soll indem geeignete Parameter ermittelt werden. Für die Visualisierung sind verschiedene Erweiterungen denkbar, z.B. die Darstellung von Streamlines.
Anforderungen
Eigenständige Einarbeitung in neues Themengebiet
Programmiererfahrung (vorrangig MATLAB, C++ wünschenswert)


 In einem laufenden Forschungsprojekt zusammen mit der Herzchirurgie des Universitätsklinikums Heidelberg untersuchen wir CNN Deep Learning-Verfahren für die 4D-Segmentierung von Herzklappen auf klinischen Datensätzen. Basierend auf einer annotierten Trainingsdatenbank sollen verschiedene Netzwerke entwickelt und miteinander verglichen werden. Die Aufgabe eignet sich als Teamprojekt, kann aber auch für eine Abschlussarbeit angepasst werden.
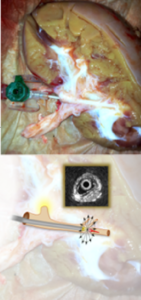 Im Rahmen aktueller Forschungsprojekte werden Strömungsverhältnisse und die Wanddicke bei Aneurysmen untersucht. Bisherige Bildgebungs-methoden können die Wanddicke nur unzureichend abbilden. Mit intravaskulärem Ultraschall kann auch die äußere Gefäßwand erfasst werden. Im Rahmen des STIMULATE Projekts wird die Eignung von intravaskulärem Ultraschall zur Beurteilung von zerebralen Aneurysmen untersucht. Das Projekt umfasst die neuartige und spannende Analyse von Gefäßinnen- und außenwand (basierend auf Tierpräparaten), die Evaluation von Stentplatzierungen und Auswertung von Strömungssimulationen.