This user has not added any information to their profile yet.
Latest Publications
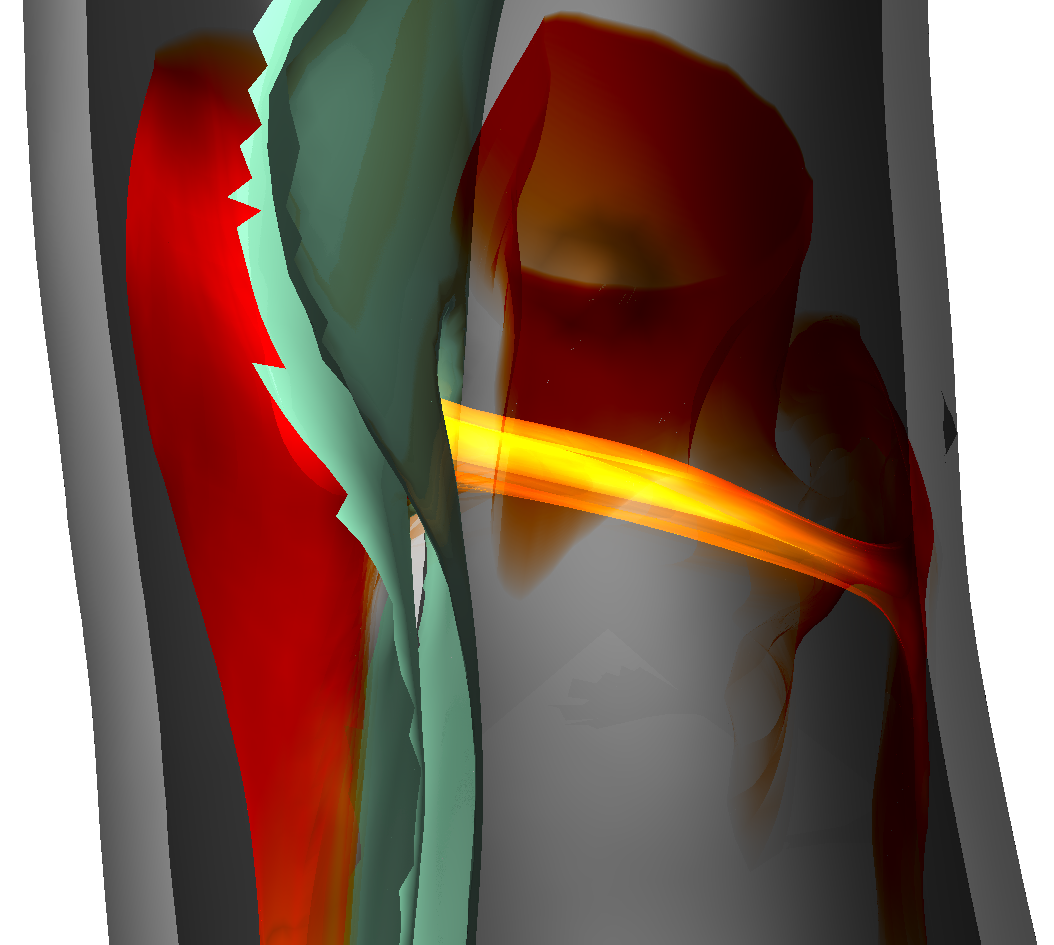 | Aaron Schroeder, Kai Ostendorf, Kathrin Bäumler, Domenico Mastrodicasa, Dominik Fleischmann, Bernhard Preim, Holger Theisel, Gabriel Mistelbauer Understanding Aortic Dissection Hemodynamics: Evaluating Adapted Smoke Surfaces Against Streakline-Based Techniques Journal Article Forthcoming IEEE Transactions on Visualization and Computer Graphics (Proc. IEEE VIS 2025), 33 (1), Forthcoming. @article{Schroeder2025, title = {Understanding Aortic Dissection Hemodynamics: Evaluating Adapted Smoke Surfaces Against Streakline-Based Techniques}, author = {Aaron Schroeder and Kai Ostendorf and Kathrin Bäumler and Domenico Mastrodicasa and Dominik Fleischmann and Bernhard Preim and Holger Theisel and Gabriel Mistelbauer}, url = {https://www.vismd.de/wp-content/uploads/2025/09/Schroeder2025.pdf https://www.vismd.de/wp-content/uploads/2025/09/Schroeder2025_plots.pdf https://www.vismd.de/wp-content/uploads/2025/09/Schroeder2025_results.xlsx}, year = {2025}, date = {2025-11-02}, journal = {IEEE Transactions on Visualization and Computer Graphics (Proc. IEEE VIS 2025)}, volume = {33}, number = {1}, publisher = {IEEE Transactions on Visualization and Computer Graphics (Proc. IEEE VIS 2025)}, abstract = {Aortic dissection is a life-threatening cardiovascular disease characterized by blood entering the media layer of the aortic vessel wall. This creates a second flow channel, known as the false lumen, which weakens the aortic wall and can potentially lead to fatal aortic rupture. Current risk stratification of aortic dissections is primarily based on morphological features of the aorta. However, hemodynamics also play a significant role in disease progression, though their investigation and visualization remain challenging. Common flow visualizations often experience visual clutter, especially when dealing with the intricate morphologies of aortic dissections. In this work, we implement and evaluate different approaches to visualizing the flow in aortic dissections effectively. We employ three techniques, namely streaklines with depth-dependent halos, transparent streaklines, and smoke surfaces. The latter is a technique based on streak surfaces, enhanced with opacity modulations, to produce a smoke-like appearance that improves visual clarity. We adapt the original opacity modulation of smoke surfaces to visualize flow even within the complex geometries of aortic dissections, thereby enhancing visual fidelity. To effectively capture dissection hemodynamics, we developed customized seeding structures that adapt to the shape of the surrounding lumen. Our evaluation, conducted via an online questionnaire, included medical professionals, fluid simulation experts, and visualization specialists. By analyzing results across these groups, we highlight differences in preference and interpretability, offering insight into domain-specific needs. No single visualization technique emerged as the best overall. Smoke surfaces provide the best overall clarity and visual realism. However, participants found streaklines with halos to be the best for quantifying flow, dispite them introducing significant visual clutter. Transparent streaklines serve as a middle ground, offering improved clarity over halos while maintaining some level of detail. Across all participant groups, smoke surfaces were rated as the most visually appealing and lifelike, with medical professionals highlighting their resemblance to contrast-agent injections used in clinical practice.}, keywords = {}, pubstate = {forthcoming}, tppubtype = {article} } Aortic dissection is a life-threatening cardiovascular disease characterized by blood entering the media layer of the aortic vessel wall. This creates a second flow channel, known as the false lumen, which weakens the aortic wall and can potentially lead to fatal aortic rupture. Current risk stratification of aortic dissections is primarily based on morphological features of the aorta. However, hemodynamics also play a significant role in disease progression, though their investigation and visualization remain challenging. Common flow visualizations often experience visual clutter, especially when dealing with the intricate morphologies of aortic dissections. In this work, we implement and evaluate different approaches to visualizing the flow in aortic dissections effectively. We employ three techniques, namely streaklines with depth-dependent halos, transparent streaklines, and smoke surfaces. The latter is a technique based on streak surfaces, enhanced with opacity modulations, to produce a smoke-like appearance that improves visual clarity. We adapt the original opacity modulation of smoke surfaces to visualize flow even within the complex geometries of aortic dissections, thereby enhancing visual fidelity. To effectively capture dissection hemodynamics, we developed customized seeding structures that adapt to the shape of the surrounding lumen. Our evaluation, conducted via an online questionnaire, included medical professionals, fluid simulation experts, and visualization specialists. By analyzing results across these groups, we highlight differences in preference and interpretability, offering insight into domain-specific needs. No single visualization technique emerged as the best overall. Smoke surfaces provide the best overall clarity and visual realism. However, participants found streaklines with halos to be the best for quantifying flow, dispite them introducing significant visual clutter. Transparent streaklines serve as a middle ground, offering improved clarity over halos while maintaining some level of detail. Across all participant groups, smoke surfaces were rated as the most visually appealing and lifelike, with medical professionals highlighting their resemblance to contrast-agent injections used in clinical practice. |
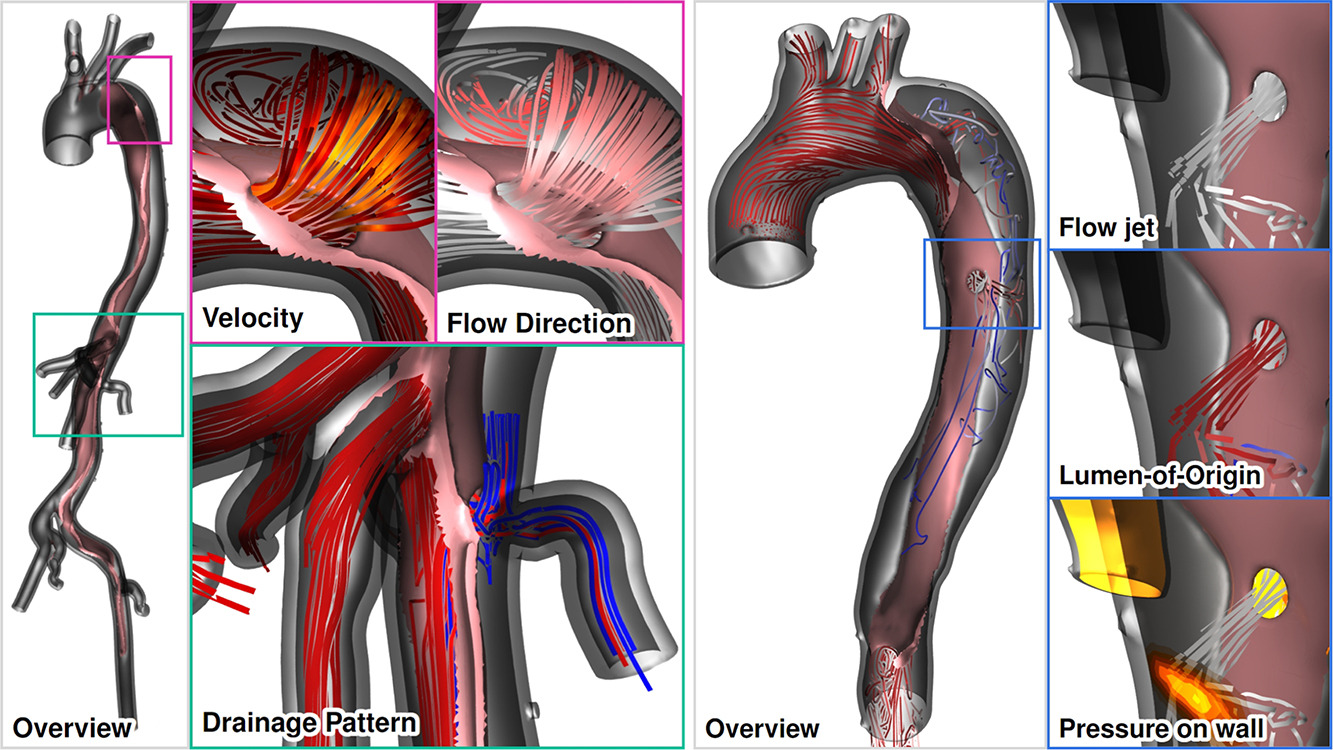 | Aaron Schroeder, Kai Ostendorf, Kathrin Bäumler, Domenico Mastrodicasa, Veit Sandfort, Dominik Fleischmann, Bernhard Preim, Gabriel Mistelbauer Advanced visualization of aortic dissection anatomy and hemodynamics Journal Article Computers & Graphics 2024, 124 , pp. 104060, 2024, ISSN: 0097-8493. @article{Schroeder2024, title = {Advanced visualization of aortic dissection anatomy and hemodynamics}, author = {Aaron Schroeder and Kai Ostendorf and Kathrin Bäumler and Domenico Mastrodicasa and Veit Sandfort and Dominik Fleischmann and Bernhard Preim and Gabriel Mistelbauer}, url = {https://www.sciencedirect.com/science/article/pii/S009784932400195X https://www.vismd.de/wp-content/uploads/2025/12/1-s2.0-S009784932400195X-main.pdf}, doi = {https://doi.org/10.1016/j.cag.2024.104060}, issn = {0097-8493}, year = {2024}, date = {2024-10-01}, journal = {Computers & Graphics 2024}, volume = {124}, pages = {104060}, abstract = {Aortic dissection is a life-threatening cardiovascular disease constituted by the delamination of the aortic wall. Due to the weakened structure of the false lumen, the aorta often dilates over time, which can – after certain diameter thresholds are reached – increase the risk of fatal aortic rupture. The identification of patients with a high risk of late adverse events is an ongoing clinical challenge, further complicated by the complex dissection anatomy and the wide variety among patients. Moreover, patient-specific risk stratification depends not only on morphological, but also on hemodynamic factors, which can be derived from computer simulations or 4D flow magnetic resonance imaging (MRI). However, comprehensible visualizations that depict the complex anatomical and functional information in a single view are yet to be developed. These visualization tools will assist clinical research and decision-making by facilitating a comprehensive understanding of the aortic state. For that purpose, we identified several visualization tasks and requirements in close collaboration with cardiovascular imaging scientists and radiologists. We displayed true and false lumen hemodynamics using pathlines as well as surface hemodynamics on the dissection flap and the inner vessel wall. Pathlines indicate antegrade and retrograde flow, blood flow through fenestrations, and branch vessel supply. Dissection-specific hemodynamic measures, such as interluminal pressure difference and flap compliance, provide further insight of the blood flow throughout the cardiac cycle. Finally, we evaluated our visualization techniques with cardiothoracic and vascular surgeons in two separate virtual sessions.}, keywords = {}, pubstate = {published}, tppubtype = {article} } Aortic dissection is a life-threatening cardiovascular disease constituted by the delamination of the aortic wall. Due to the weakened structure of the false lumen, the aorta often dilates over time, which can – after certain diameter thresholds are reached – increase the risk of fatal aortic rupture. The identification of patients with a high risk of late adverse events is an ongoing clinical challenge, further complicated by the complex dissection anatomy and the wide variety among patients. Moreover, patient-specific risk stratification depends not only on morphological, but also on hemodynamic factors, which can be derived from computer simulations or 4D flow magnetic resonance imaging (MRI). However, comprehensible visualizations that depict the complex anatomical and functional information in a single view are yet to be developed. These visualization tools will assist clinical research and decision-making by facilitating a comprehensive understanding of the aortic state. For that purpose, we identified several visualization tasks and requirements in close collaboration with cardiovascular imaging scientists and radiologists. We displayed true and false lumen hemodynamics using pathlines as well as surface hemodynamics on the dissection flap and the inner vessel wall. Pathlines indicate antegrade and retrograde flow, blood flow through fenestrations, and branch vessel supply. Dissection-specific hemodynamic measures, such as interluminal pressure difference and flap compliance, provide further insight of the blood flow throughout the cardiac cycle. Finally, we evaluated our visualization techniques with cardiothoracic and vascular surgeons in two separate virtual sessions. |
Aaron Schroeder Smoke-Like Visualization of Aortic Dissection Hemodynamics Masters Thesis Dept. of Computer Science, 2024. BibTeX | Links: @mastersthesis{Schroeder_2024, title = {Smoke-Like Visualization of Aortic Dissection Hemodynamics}, author = {Aaron Schroeder}, url = {https://www.vismd.de/wp-content/uploads/2024/10/Masterarbeit_Aaron_Schroeder.pdf}, year = {2024}, date = {2024-07-02}, school = {Dept. of Computer Science}, keywords = {}, pubstate = {published}, tppubtype = {mastersthesis} } | |
Aaron Schroeder Flow Visualization of Aortic Dissections Masters Thesis Dept. of Computer Science, 2021. BibTeX | Links: @mastersthesis{Schroeder2021, title = {Flow Visualization of Aortic Dissections}, author = {Aaron Schroeder}, url = {https://www.vismd.de/wp-content/uploads/2021/05/Flow-Visualization-of-Aortic-Dissections-.pdf, PDF Download}, year = {2021}, date = {2021-05-17}, school = {Dept. of Computer Science}, keywords = {}, pubstate = {published}, tppubtype = {mastersthesis} } |