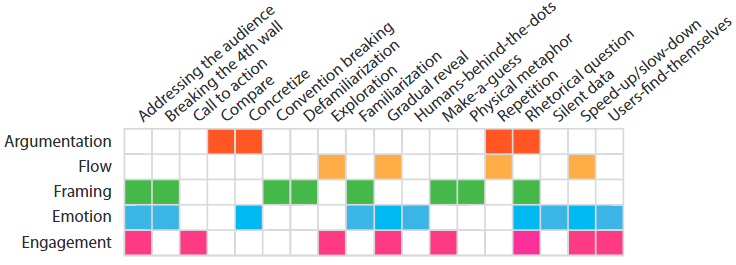
Narrative visualization, i.e. the combination of storytelling techniques with interactive graphics is a powerful option to visually communicate complex data and research findings, such as medical data. A compelling narrative visualization connects data elements or events, often time-related, into a clear and memorable story. Moreover, a story can be told in different ways, e.g., engaging or emotional, depending on the author’s intent and audience. Bach et al. [1] described eighteen narrative design patterns that can be used to tell data stories, see Figure 1. However, little research has been done on which of these patterns are suitable for communicating medical data and issues, and whether specific medical design patterns can be derived.

Goal: The goal should be a comprehensive analysis of medical blogs/YouTube videos and interactive health-related stories in newspapers with respect to narrative patterns detected. Based on this analysis, research questions should be answered, such as whether there is a need for new patterns for medical visualization and whether existing patterns can be made more concrete to better fit medical data.
Type: Bachelor/ or Master Thesis (Team project (2 FIN students) would also be possible)
Requirements: Good skills in scientific reading and summarizing scientific papers; critical and creative thinking.
References
[1] Bach, B., et al. “Narrative design patterns for data-driven storytelling.” Data-driven storytelling. AK Peters/CRC Press, 2018. 107-133.: chrome-extension://oemmndcbldboiebfnladdacbdfmadadm/https://datavis2020.github.io/pdfs/Narrative_Design_Patterns__for_Data_Driven_Storytelling.pdf
[2] Hullman, J., et al., “Visualization rhetoric: Framing effects in narrative visualization,” IEEE Trans Vis Comput Graph, vol. 17, pp. 2231-40, 2011.: https://ieeexplore.ieee.org/abstract/document/6064988
[3] Meuschke, M., et al. “Towards Narrative Medical Visualization.” arXiv preprint arXiv:2108.05462 (2021).: https://arxiv.org/abs/2108.05462
