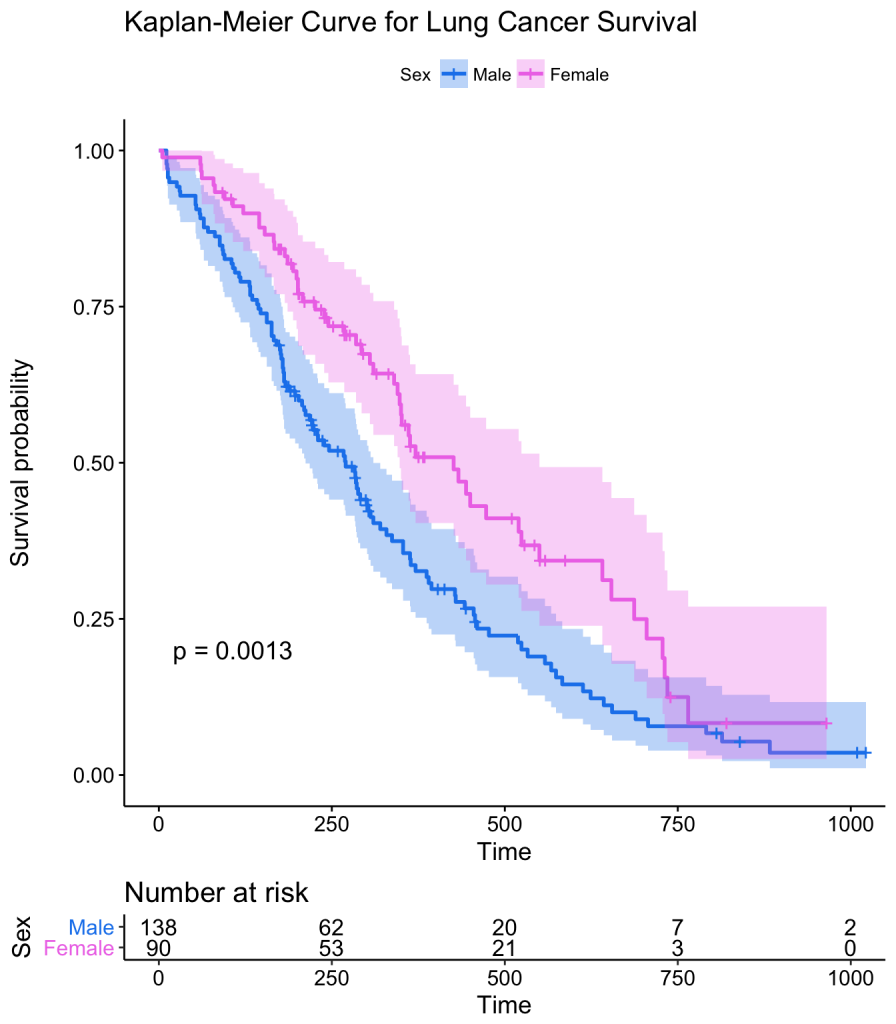
The comprehensible communication of medical research to the broad public plays an important role in many situations, such as education about preventive examinations or vaccinations. Recently, narrative visualization, i.e. the combination of storytelling techniques with interactive graphics is used to communicate scientific findings. A variety of information visualizations such as diagrams and 2D maps have been used to visually communicate scientific findings. However, little research has been done on how comprehensible annotated diagrams such as bubble charts or medical expert diagrams such as Kaplan-Meier plots are for the broad public or how these representations need to be adapted.

Goal: The goal should be to investigate different information visualization techniques regarding their suitability to visually communicate medical information to the broad public. Based on this analysis, guidelines should be derived on how information visualizations need to be adapted to become understandable for people without specific medical background knowledge. The adapted visualizations should be evaluated with participants from the broad public to validate their understandability.
Type: Bachelor/ or Master Thesis (Team project (2 FIN students) would also be possible)
Requirements: Good skills in scientific reading; critical thinking; good skills in graphics programming (exact languages like D3 or OpenGL can be chosen freely)
References
[1] Morris, T., et al. “Proposals on Kaplan–Meier plots in medical research and a survey of stakeholder views: KMunicate.” BMJ open 9.9 (2019): e030215.: https://bmjopen.bmj.com/content/9/9/e030215.abstract
[2] Drucker, S., et al. “Communicating data to an audience.” In Data-driven storytelling, pp. 211-31. AK Peters/CRC Press, 2018: chrome-extension://oemmndcbldboiebfnladdacbdfmadadm/https://hal.archives-ouvertes.fr/hal-02310515/document
[3] Meuschke, M., et al. “Towards Narrative Medical Visualization.” arXiv preprint arXiv:2108.05462 (2021).: https://arxiv.org/abs/2108.05462
