Themen in Magdeburg
Adapted InfoVis Graphics to Communicate Medical Data
The comprehensible communication of medical research to the broad public plays an important role in many situations, such as education about preventive examinations or vaccinations. Recently, narrative visualization, i.e. the combination of storytelling techniques with interactive graphics is used to communicate scientific findings. A variety of information visualizations such as diagrams and 2D maps have been used to visually communicate scientific findings. However, little research has been done on how comprehensible annotated diagrams such as bubble charts or medical expert diagrams such as Kaplan-Meier plots are for the broad public or how these representations need to be adapted.
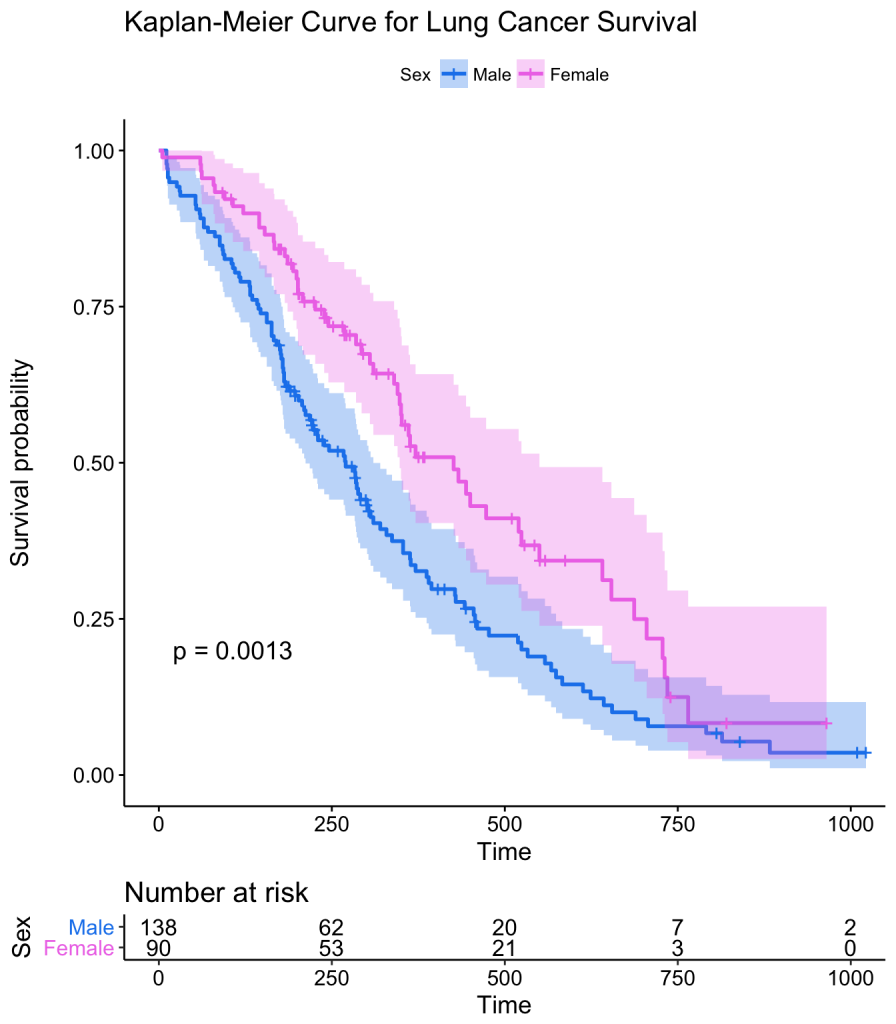
Goal: The goal should be to investigate different information visualization techniques regarding their suitability to visually communicate medical information to the broad public. Based on this analysis, guidelines should be derived on how information visualizations need to be adapted to become understandable for people without specific medical background knowledge. The adapted visualizations should be evaluated with participants from the broad public to validate their understandability.
Type: Bachelor/ or Master Thesis (Team project (2 FIN students) would also be possible)
Requirements: Good skills in scientific reading; critical thinking; good skills in graphics programming (exact languages like D3 or OpenGL can be chosen freely)
References
[1] Morris, T., et al. “Proposals on Kaplan–Meier plots in medical research and a survey of stakeholder views: KMunicate.” BMJ open 9.9 (2019): e030215.: https://bmjopen.bmj.com/content/9/9/e030215.abstract
[2] Drucker, S., et al. “Communicating data to an audience.” In Data-driven storytelling, pp. 211-31. AK Peters/CRC Press, 2018: chrome-extension://oemmndcbldboiebfnladdacbdfmadadm/https://hal.archives-ouvertes.fr/hal-02310515/document
[3] Meuschke, M., et al. “Towards Narrative Medical Visualization.” arXiv preprint arXiv:2108.05462 (2021).: https://arxiv.org/abs/2108.05462
Develop VR/Web Radiochemistry Application for Students
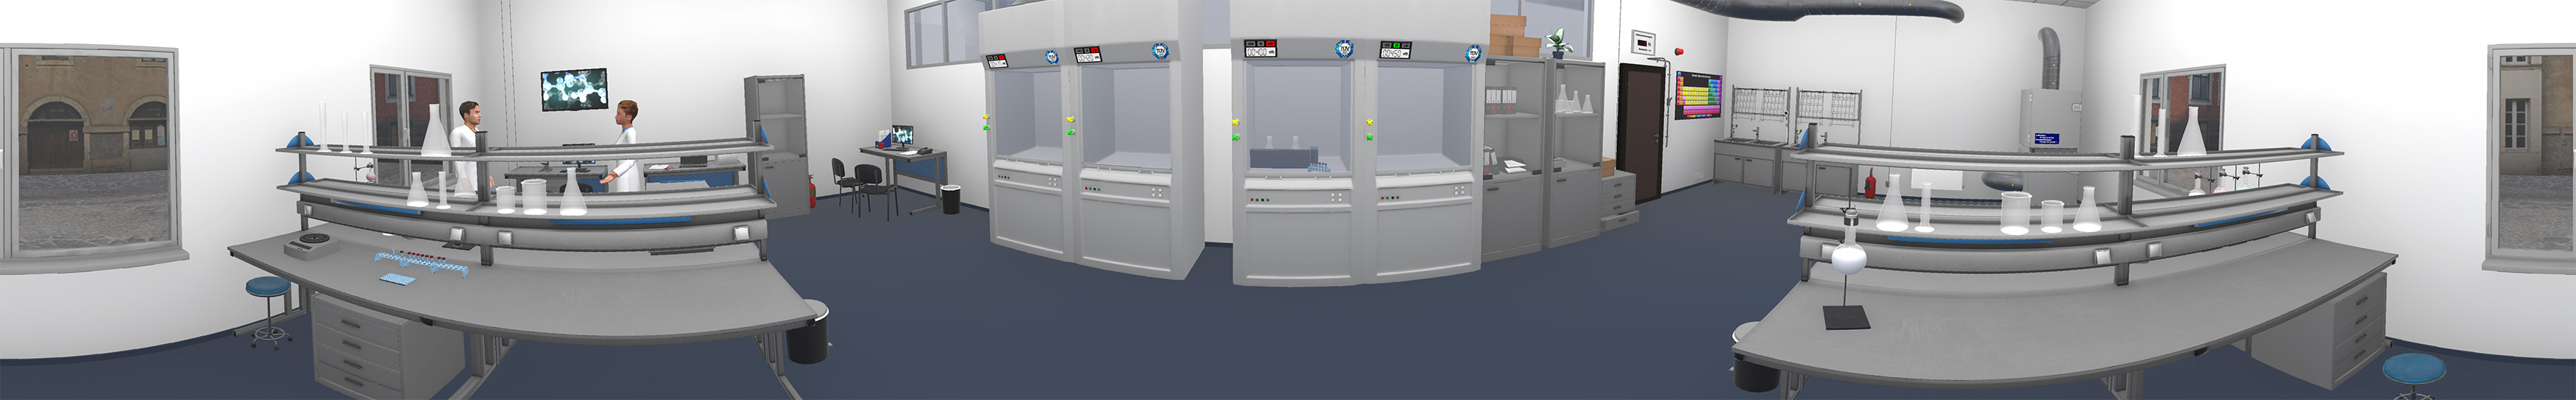
Within the European A-CINCH project, which addresses the loss of the young generation’s interest for nuclear knowledge, virtual experiments are developed.
Tasks:
- Develop a radiochemistry experiement as a VR and web application
- Evaluate its user experience and usability
The project has to be realised in the game engine Unity, thus the following is required:
- Knowledge of basic computer graphics
- Experience with C# and Unity
Master Thesis: Deep Learning Based Segmentation Task of medical CT-Images based on advanced Preprocessing
Current state:
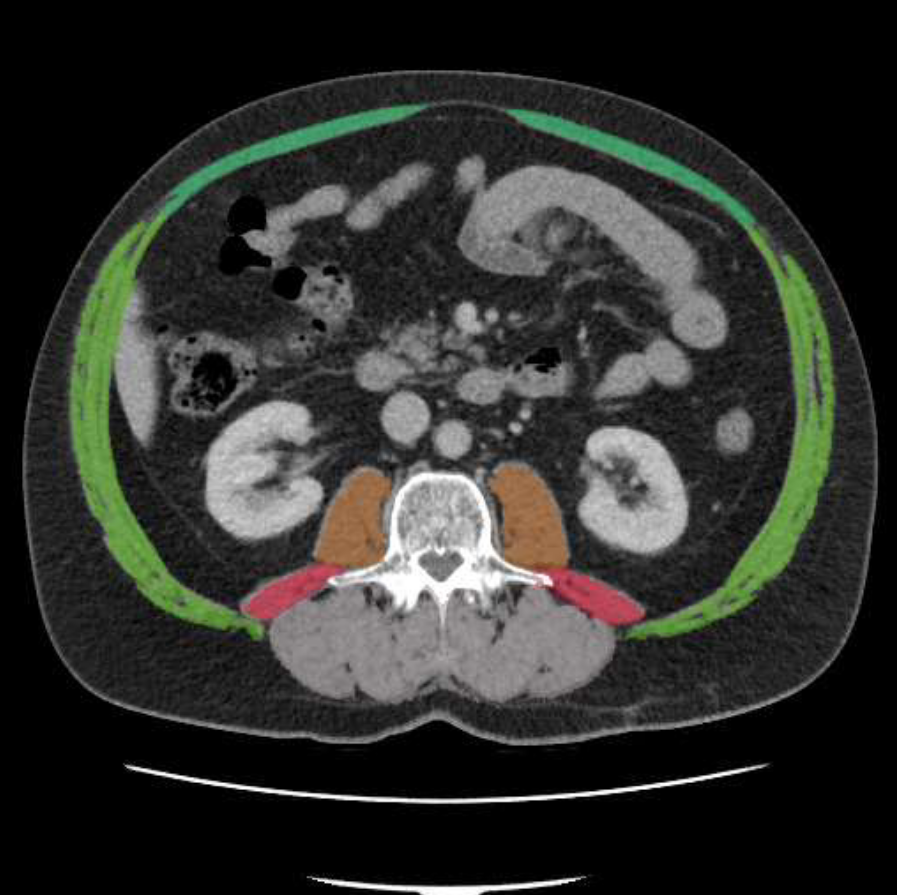
The chances of success of tumor treatment are highly dependent on the patient’s physical condition. In everyday clinical practice, the patient’s BMI is calculated for this purpose. However, this is a rather inaccurate measure, since the distribution of muscle to fat tissue is a decisive indicator. For a more accurate evaluation, the patient’s CT images must be evaluated. However, this is a time-consuming task.
Scope of the thesis:
This work is intended to address the problem. Currently, data are being acquired in clinical practice and segmented by experts. These are CT data sets in which muscle and fur tissues were segmented in one layer. Your task is to create an automatic segmentation using Deep Learning methods. Subsequently, the segmented regions are to be evaluated with the help of a measure. The explicitly mentioned preprocessing step is to split the given segmentation (symmetry of the body) to provide more data to the network during the learning process. An optional extension would be the automatic selection of the layer in which the evaluation should take place.
We offer:
- interesting clinically relevant research
- support in technical questions and writing of the thesis
We expect:
- good programming skills (Python)
- knowledge of image processing
- experience with Deep Learning and frameworks (Pytorch, Tensorflow, Keras)
- good study achievements
Interactive Blood Flow Exploration – In collaboration with Dept. of Neurology, OVGU and Inria, France
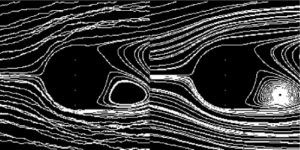
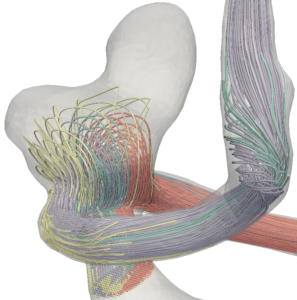
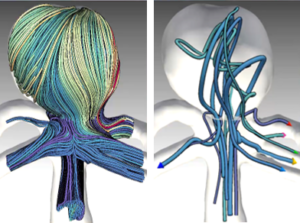 In cerebral aneurysm research, CFD simulations allow us to gain a better understanding of the dynamics of the blood flow. The simulated flow is often visualized using integral curves resulting in cluttered “spaghetti plots”. Advanced approaches group similar curves and show only selected representatives (image). These approaches however, fail in showing the clusters’ spatial extent. In this thesis, an interactive approach facilitating a continuous transition between the full set of integral curves and an uncluttered abstracted visualization shall be developed. Browsing back and forth through various levels of abstraction shall allow the user to grasp both, the general structure of the blood flow pattern as well as the spatial extent of individual substructures.
Requirements: Good to very good programming skills (C++) are mandatory
3D-Stereoverfahren für die Herzchirurgie
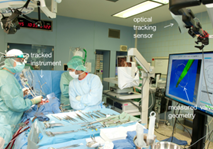 Im Rahmen der Arbeit sollen Stereoverfahren für die 3D-Rekonstruktion von Strukturen aus intraoperativen Endoskopiebildern entwickelt werden. Die Arbeit wird in enger Kooperation zwischen der Fakultät Informatik der OvGU Magdeburg (Dr. Sandy Engelhardt) und der Herzchirurgie des Universitätsklinikums Heidelberg (Prof. De Simone) durchgeführt. Weitere Themen für Abschlussarbeiten sind vorhanden. Melden Sie sich gern bei Interesse.
Aufgaben
- Meshing einer rekonstruierten 3D-Punktewolke
- Texturierung der Oberfläche
- Fusion von verschiedenen Ansichten zu einem Mesh
Anforderungen: Programmiererfahrung in C++ (OpenCV- Kenntnisse hilfreich)
Master-Arbeit: Skizzenbasierte Kartenprojektion für zerebrale Aneurysmen
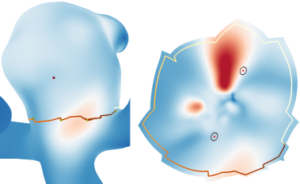 Zerebrale Aneurysmen sind pathologische Aussackungen der Gefäßwand, welche meistens an den Bifurkationen der großen Hirnarterien auftreten. Die Gefäßwand besitzt an diesen Stellen ein hohes Rupturisiko, was zu starken inneren Blutungen führt und in 60 % der Fälle den Tod des Patienten zur Folge hat. Daher ist eine patientenspezifische Einschätzung des Rupturrisikos nötig. Jedoch hängt die Ruptur von zahlreichen Kriterien ab, deren Zusammenhänge bisher nicht ausreichend verstanden sind. Blutflusssimulationen helfen dabei das patientenspezifische Rupturrisiko zu analysieren. Jedoch handelt es sich dabei um sehr komplexe Daten, was deren Auswertung enorm erschwert. Mit Hilfe von Standardtechniken wie Farbkodierungen und Animationen in 3D versuchen Experten rupturgefährdete Gefäßregionen ausfindig zu machen. Auftretende Verdeckungen machen es jedoch nahezu unmöglich über die Zeit Hochrisikoregionen zu finden. 2D Projektionen der 3D Gefäßgeometrie werden häufig eingesetzt, um verdeckungsfreie Überblicksvisualisierungen zu erzeugen. Jedoch führen derartige Projektionen zu Verzerrungen, die die Datenanalyse erschweren.
Ziel: Skizzenbasierte Katenprojektion für zerebrale Aneurysmen, die die verdeckungsfreie Darstellung des Aneurysmas und benachbarter Gefäße erlaubt
Anforderungen: Programmiererfahrung in C# oder C++ (VTK- und Matlab-Kenntnisse hilfreich)
Evaluierung von Kartenprojektionen für zerebrale Aneurysmen
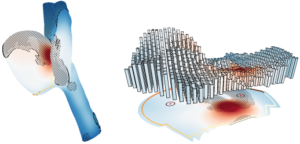 Zerebrale Aneurysmen sind pathologische Aussackungen der Gefäßwand, welche meistens an den Bifurkationen der großen Hirnarterien auftreten. Die Gefäßwand besitzt an diesen Stellen ein hohes Rupturisiko, was zu starken inneren Blutungen führt und in 60 % der Fälle den Tod des Patienten zur Folge hat. Blutflusssimulationen helfen dabei das patientenspezifische Rupturrisiko zu analysieren. Jedoch handelt es sich dabei um sehr komplexe Daten, was deren Auswertung enorm erschwert. Mit Hilfe von Standardtechniken wie Farbkodierungen und Animationen in 3D versuchen Experten rupturgefährdete Gefäßregionen ausfindig zu machen. Auftretende Verdeckungen machen es jedoch nahezu unmöglich über die Zeit Hochrisikoregionen zu finden.
Ziel: Evaluation verschiedene Projektionstechniken für eine eine verdeckunsfreie Darstellung des Gefäßes
Anforderungen: Programmiererfahrung in C# oder C++ (VTK- und Matlab-Kenntnisse hilfreich)
Master-Arbeit: Evaluierung von Glättungsverfahren für Vektorfelder gemessener Blutflussdaten
 Die patientenspezifische Hämodynamik spielt eine zentrale Rolle in der Entwicklung und dem Voranschreiten kardiovaskulärer Krankheiten. Informationen über die patientenspezifische Hämodynamik können nicht invasiv mit Hilfe der 4D Phasen-Kontrast-Magnet-Resonanz Bildgebung aufgenommen werden.Ein Nachteil gemessener Flussdaten ist ihre Anfälligkeit gegenüber Rauschen, was die weitere Analyse erschwert.
Ziel: Quantitative und qualitative Evaluation der Eignung verschiedener Glättungsverfahren für gemessene Flussdaten
Anforderungen: Programmiererfahrung in C# oder C++ (VTK- und Matlab-Kenntnisse hilfreich)
Exploration von Clustering-Ergebnissen in zerebralen Aneurysmen
 Zerebrale Aneurysmen sind pathologische Aussackungen der Gefäßwand, welche meistens an den Bifurkationen der großen Hirnarterien auftreten. Die Gefäßwand besitzt an diesen Stellen ein hohes Rupturisiko, was zu starken inneren Blutungen führt und in 60 % der Fälle den Tod des Patienten zur Folge hat. Neben morphologischen Aspekten werden bestimmte Blutflussmuster, wie Verwirbelungen mit einem erhöhten Rupturrisiko in Verbindung gebracht. Um den Einfluss von Verwirbelungen auf die Gefäßwand zu verstehen, müssen diese angemessen visualisiert und exploriert werden können. Eine Möglichkeit der Flussvisualisierung ist die Darstellung des gemessenen oder simulierten Vektorfeldes durch Integrallinien. Das Anzeigen aller Integrallinien führt jedoch zu visuellen Überlagerungen, wodurch die Exploration von zeitlich und/oder räumlich dicht zusammenliegenden Verwirbelungen erschwert wird. Daher wurden Clustering-Methoden entwickelt, die die Integrallinien zu Gruppen zusammenfassen.
Ziel: Eine stufenweise Visualisierung und Exploration dieser Gruppen
Anforderungen: Programmiererfahrung in C# oder C++ (VTK- und Matlab-Kenntnisse hilfreich)