VisGroup@VCBM
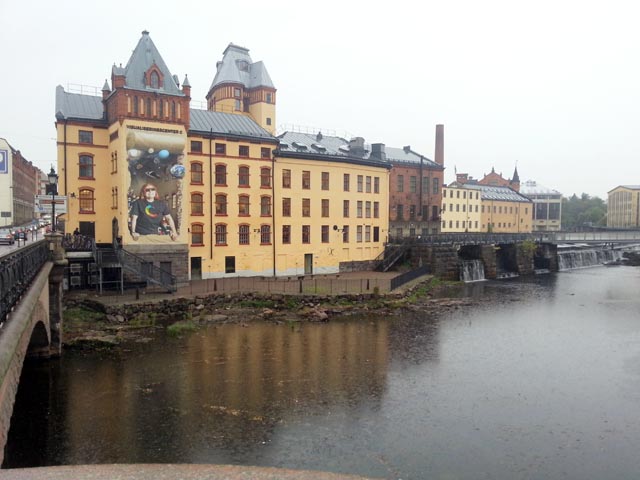
Visualization Center @ Norrköping, Sweden 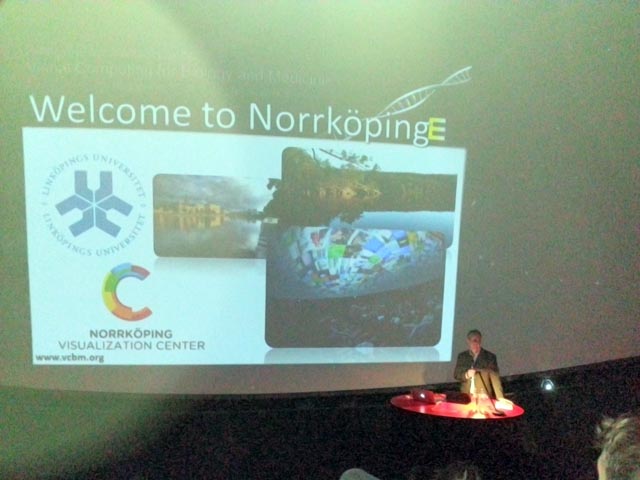
Timo Ropinski @ Welcome-talk
This year’s Eurographics Workshop on Visual Computing in Biology and Medicine (www.vcbm.org) took place at the Visualization Center in Norrköping, Sweden. From the 17 full paper presentations, three were given by our group.
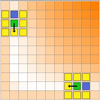
Katja Mogalle presented a method for automatic label placement in 2D image slices for the reading of radiological images. Based on a case study, the main constraints for label placement have been analyzed and are evaluated for finding valid and suitable label positions.
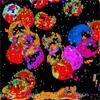
Steffen Oeltze described a volume rendering approach for visualizing protein patterns of 3D toponome data. The utility provides multiple coordinated views and techniques for interacting with the 3D view in an exploratory analysis.
Tobias Mönch developed a framework, which allows to perform mesh smoothing and model quality estimation in real-time. Based on an OpenGL implementation, suggestions for optimal smoothing parameters may determined and used to simply the use of mesh smoothing filters. This paper has been selected as one of the three best papers and has been invited for publication in Computer Graphics Forum.
 Prof. Thomas Flohr, Heads of CT Physics and Application Development SIEMES Healthcare Erlangen hält am 19. Juli um 15.30 Uhr im Geb. 09, Raum 211 im Rahmen des Kolloquiums Medizintechnik einen Vortrag zum Thema “Neue Entwicklungen in der CT-Technologie”.
 In the course of the
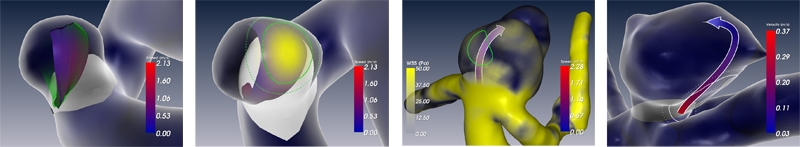
 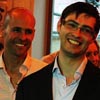 Last week, we visited our dear fellow visualization researchers Roy van Pelt and Ralph Brecheisen, who successfully defended their PhD-theses in Eindhoven, Netherlands. Both presented their outstanding work in the fields of illustrative flow visualization (Real-time Illustrative Visualization of Cardiovascular Hemodynamics – Roy van Pelt) and DTI visualization (Visualization of Uncertainty in Fiber Tracking based on Diffusion Tensor Imaging – Ralph Brecheisen). We also witnessed the interesting formal procedure of defending a thesis in the Netherlands.
 Vortrag im Rahmen des “User Interface Kolloquiums” am 31. Mai 2012 um 13.15 Uhr im Raum 29-301: Dr. Felix Ritter (Fraunhofer MEVIS Bremen): “Advancing the User Experience in Reading of Medical Images”
  We are happy to have two guests this week. Charl Botha (TU Delft) came already last week and stays for five weeks as a guest professor. Charl looks at our projects and gives advice, he give a talk in the
  Peter Kohlmann, senior researcher from Fraunhofer MEVIS will visit us on Thursday, exchanging particularly with respect to perfusion data and blood flow data. Peter will give a talk in the
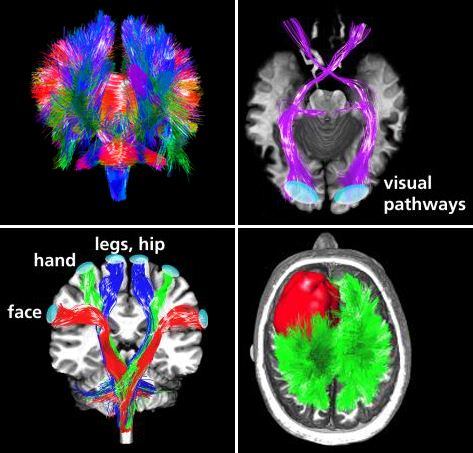
 The long and fruitful collaboration between the Visualization group and Fraunhofer MEVIS Bremen lead to another nice success. Benjamin Köhler, currently student assistant in our group, will be awarded with the BVM-Award from the German medical image processing society, acknowledging his extraordinary Bachelor thesis. The thesis was based on an internship at Fraunhofer MEVIS Bremen, supervised jointly by Dr. Jan Klein (Fraunhofer MEVIS) and Bernhard Preim. Ben’s work was integrated in the MEVIS activities on the reconstruction of HARDI data, a relatively new kind of data for analysing human white matter. Ben’s work was an extraordinarily deep analysis of fiber reconstruction with global optimization methods. The award will be presented at the BVM workshop where Ben will present the results of his current research on visualizing blood flow data and now may also report on his award-winning work.